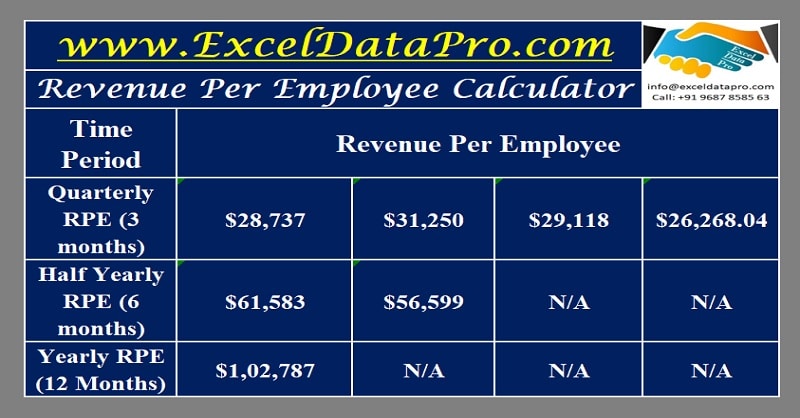
Use this Online Revenue Per Employee Calculator to get the desired metric in just a few clicks or download a free template in Excel.
| Revenue Per Employee Calculator | |
|---|---|
| Total Revenue of the Company | |
| Total Number of Employees | |
| Revenue Per Employee : | |
Revenue Per Employee Calculator is a ready-to-use Excel Template to calculate Revenue per employee on a quarterly, half-yearly, and yearly basis.
What is Revenue Per Employee?
Revenue per employee is an HR metric used to measure the average revenue generated by each employee for a particular period. It measures the performance of the human resources employed by a company. In simple terms, it is a measure of how efficiently the human resources of an organization are utilized.
It indicates the productivity of each personnel of a company. It helps in the efficient utilization of a company’s workforce. Ideally, every organization expects the highest revenue per employee possible. The higher revenue indicates higher productivity.

How to Calculate Revenue Per Employee?
Revenue per employee is very simple to calculate. The formula to calculate Revenue Per Employee(RPE) as follows:
Total Revenue of the Company
Total No. of Employees
Click here to know more about Revenue Per Employee.
Revenue Per Employee Calculator Excel Template
We have created a simple and ready-to-use Revenue Per Employee Calculator in Excel with predefined formulas. This template will help you calculate Revenue Per Employee on a quarterly, half-yearly, and yearly basis.
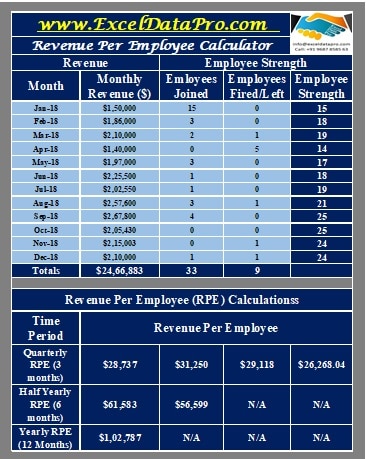
You just need to enter your monthly revenue and the addition or deduction in the workforce during that particular month and it will automatically calculate the Revenue Per Employee for you.
Click here to download the Revenue Per Employee Calculator Excel Template.
Click here to Download All HR Metrics Excel Templates for ₹299.You can download other useful HR Metrics Templates like Profit Per Employee calculator, Human Capital ROI Calculator, Total Compensation Spend Rate Calculator, and many more from our website.
How To Use Revenue Per Employee Calculator Excel Template?
Revenue Per Employee or RPE Calculator is very easy to use. This template consists of 3 sections:
- Company Details
- Monthly Data
- RPE Calculations
1. Company Details
Company details consist of the company name, the company logo, and the heading of the sheet. If you are an independent HR analyst then you can make multiple sheets for sheets and enter the company name of your clients in this section.

2. Monthly Data
Monthly Data consists of monthly revenue of the company as well as the addition/deduction in the workforce during that particular month.
Simply enter the monthly revenue against the respective month. Furthermore, if employees are added to the workforce then enter the number of employees in the “Employees Joined” column.
Similarly, if employees have left or have been fired during that particular month, you need to enter the number of employees in the “Employees Fired/Left” column.
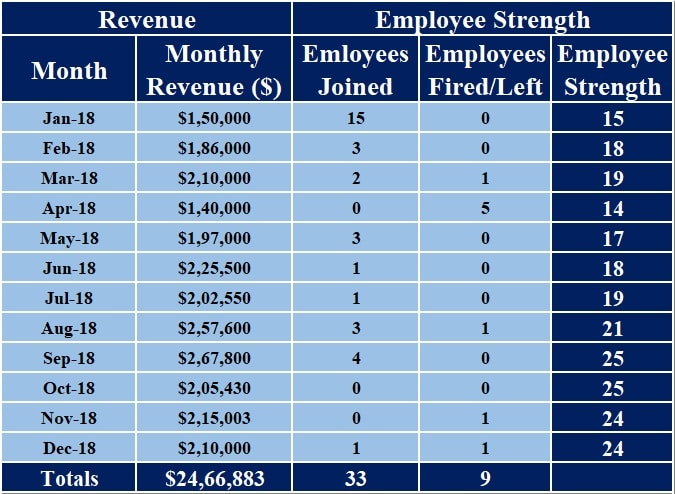
When you enter the employee joined and left data it will automatically calculate the total strength of the company during that month. This will later be useful in calculating the Revenue Per Employee.
The total revenue for the year has been given at the end of the “Revenue” column. Similarly, the total number of employees left and the total number of employees joined during a particular period have been given.
3. RPE Calculations
The RPE Calculations include 4 quarterly, 2 half-yearly, and 1 yearly RPE Calculation.
RPE Quarterly:
Sum of Every 3 months revenue
Employee Strength at the end of every 3 months
RPE Half Yearly:
Sum of Every 6 months revenue
Employee Strength at the end of every 3 months
RPE Yearly:
Total Revenue of the Company during the year
Employee Strength at the end of every 3 months
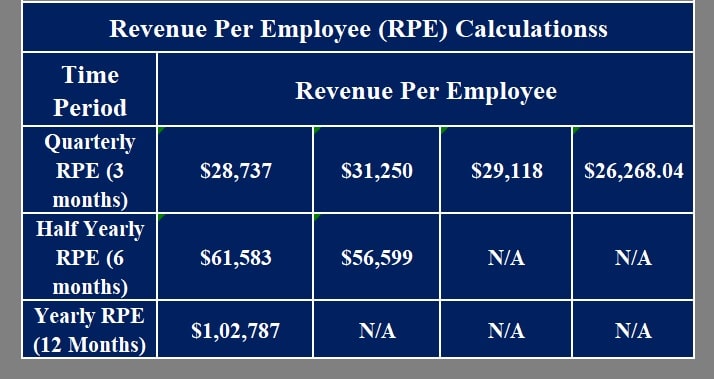
That’s it. as you update your revenue and employee figures the template will automatically calculate the Revenue Per Employee for you.
Important Points to Consider While Calculating Revenue Per Employee
Higher the RPE the better it is. RPE will differ in different industries according to the intensity of labor. In labor-intensive industries, the RPE is less whereas in the high tech it is high as they are low labor-intensive companies.
If RPE is used to be used for an analytical purpose, it should be compared to the historical data of the company. For example, the data for 5 years must be compared. It should also be compared to your competitor’s data. This historical and across industry comparison will give useful insights related to the productivity of your employed personnel.
Company age is also a factor that affects the RPE of a company. New startups will have small revenues and will have a high recruiting ratio. This will eventually decrease the RPE. Whereas established and old companies will have high RPE due to less recruitment ratio and high revenues.
This template can be useful to HR analysts, HR professional, HR assistants, and also to small business owners
We thank our readers for liking, sharing, and following us on different social media platforms.
If you have any queries or suggestions please share in the comment section below. I will be more than happy to assist you.
Leave a Reply