Ratio Analysis Template is a ready-to-use template in Excel, Google Sheets, and OpenOffice Calc that helps you to know the financial performance in key areas. All you need to do is to enter data from your financial statements and the template will automatically calculate the ratios.
Table of Contents
What Is Ratio Analysis?
Ratio Analysis is a type of Financial Statement Analysis used to obtain a rapid indication of a company’s financial performance in key areas.
You can use Ratio analysis to evaluate various aspects of a company’s operating and financial performance like its efficiency, liquidity, profitability, and solvency, etc.
Types of Ratios
Ther are five types of ratios evaluated while performing Ratio Analysis: growth, profitability, operations, liquidity, and solvency ratios. Now, let us understand the components of each in brief.
Profitability Ratio
Profitability ratios are financial metrics that help us to know the ability to generate earnings. This includes Profit Margin, Return on Assets, Return on Equity, Dividend Payout Ratio, and PE(Price Earnings) Ratio.
Profit Margin
The profit margin ratio helps us to know the overall percentage of profit a business makes against its revenue. The formula to calculate Profit Margin is as below:
Profit Margin = Income From Operations/Total Revenue
Return on Assets
Return on assets indicates how a business is profitable against its assets. In other words, it determines the efficiency to generate earnings using its assets. The formula to calculate Return on Assets is as follows:
Return on Asset = Net Income/Total Assets
Return on Equity
Similar to Return on Asset, Return on equity is a measure that helps us to know the effectiveness of equity in generating profits. The formula to calculate Return of Equity is as follows:
Return on Equity = Net Income/ Average Shareholder’s Equity
where, Average Shareholder Equity = (Current Year Equity + Previous Year Equity) / 2
Dividend Payout Ratio
The dividend payout ratio describes the ratio dividend paid to the shareholders against the net income of the company. The formula to calculate the dividend payout ratio is as follows:
Dividend Payout Ratio = Dividend Paid / Net Income
Price Earning Ratio (PE Ratio)
The price-to-earnings ratio or PE ratio provides the ratio of earnings per share against the current market price per share. The formula to calculate the PE ratio is as follows:
PE Ratio = Market Value Per Share / Earning Per Share
Growth Ratio
Growth ratios are indicators of how fast our business is growing. These growth ratios include sales growth, income growth, and asset growth.
Sales Growth
Sales growth is a metric that shows the percentage of increase in sales over a specific period. Furthermore, it helps us to understand the demand for products/services in the near future. The formula to calculate Sales growth percentage is as follows:
Sales Growth = (Current Year Revenue – Previous Year Revenue)/Previous Year Revenue
Income Growth
Income growth is a metric that shows the percentage of increase in profit compared to the previous year. Moreover, it helps us to understand the growth of sales as well as the performance of our product line. The formula to calculate Income growth is as follows:
Income Growth = (Net Profit Current – Net Profit Previous) / Net Profit Previous
Asset Growth
Asset growth is a metric that shows the percentage of growth in assets over a specific period. Hence, it helps to determine the increase in assets of the business. The formula to calculate Asset growth is as below:
Asset Growth = (Total Asset Current – Total Asset Previous) / Total Asset Previous
Activity Ratio
Activity ratios are financial metrics that indicate the efficiency to leverage its assets to generate revenues and cash. These include receivables turnover, inventory turnover, and fixed asset turnover.
Receivable Turnover
The receivables turnover ratio is an accounting metric that quantifies the effectiveness of collecting accounts receivables.
Thus, a higher Receivable turnover indicates the company’s efficiency in the timely collection of receivables and also good clientele that pays off debt quickly. The formula to calculate Receivable turnover is as follows:
Receivable Turnover = Revenue / Average Accounts Receivables
Where Average (A/R = A/R Current + A/R Previous) / 2.
Inventory Turnover
Inventory turnover is a ratio that shows the number of times a business replaces its inventory during a given period.
In addition to that, it helps a business in making better decisions related to pricing, production as well as marketing. The formula to calculate Inventory Turnover is as follows:
Inventory Turnover = Sales / Average Inventory
Where Average Inventory = (Inventory Current + Inventory Previous) / 2.
Fixed Asset Turnover
Fixed Asset Turnover Ratio is a metric that defines the ability to effectively generate sales using its fixed assets.
Thus, a higher Fixed Asset Turnover Ratio indicates efficient use of its fixed assets in generating sales and vise versa. The formula to calculate Fixed Asset Turnover is as follows:
Fixed Asset Turnover = Net Revenue / Total Fixed Assets
Liquidity Ratio
Liquidity ratios are financial metrics that help to determine a business’s ability to pay off its debts without raising external capital. It includes the Current Ratio and Quick Ratio.
Current Ratio
The current ratio helps to measures the ability to pay short-term debt obligations within the current period.
Moreover, it helps to know how a business can maximize its current assets even by paying its current debt and other payables. The formula to calculate Current Ratio is as given below:
Current Ratio = Current Asset / Current Liabilities
Quick Ratio
Quick Ratio defines a company’s ability to meet its short-term debt obligations with its most liquid assets.
Furthermore, a higher Quick ratio determines better liquidity and financial health. Whereas a lower quick ratio defines that the organization will have difficulties paying its debts. The formula to calculate the Quick Ratio is as follows:
Quick Ratio = (Cash Equivalents + Inventory + Accounts Receivable) / Current Liabilities
Solvency Ratio
The solvency ratio determines the ability to meet its long-term debt obligations. Moreover, a higher solvency ratio indicates an increased ability to cover its liabilities over a long period.
Debt to Total Asset Ratio
The Debt to Total Assets ratio defines the total amount of debt relative to assets owned by a company.
While calculating this ratio, all of the company’s debts must be considered including loans and bonds payable. Similarly, all assets must be considered including intangible assets. The formula to calculate Debt TO Total Asset Ratio is as below:
Debt To Total Asset Ratio = Total Liabilities / Total Assets
Ratio Analysis Template
We have created a Ratio Analysis Template with all growth, profitability, operations, liquidity, and solvency ratios. All the ratios are configurated with a predefined formula.
The user just needs to input data from the financial statements of the company in the Datasheet. It will automatically calculate the ratios. Furthermore, all the formulas for ratio are predefined. Thus, entering the data will derive all the ratios.
Excel Google Sheets Open Office Calc
Click here to Download All Financial Analysis Excel Templates for ₹299.
Additionally, you can download other Financial Analysis templates like Break-Even Analysis Template, Business Net Worth Calculator, Break-Even Analysis Template, and Sales Revenue Analysis Template
Let us discuss the Contents of the Ratio Analysis Template in detail.
Contents of Ratio Analysis Template
This template consists of two worksheets, Datasheet and Ratio Analysis Sheet.
DataSheet
The Datasheet workbook has 5 sections: Header, Income Statement, Balance Sheet, Cash Flow, and Shareholder’s Equity.
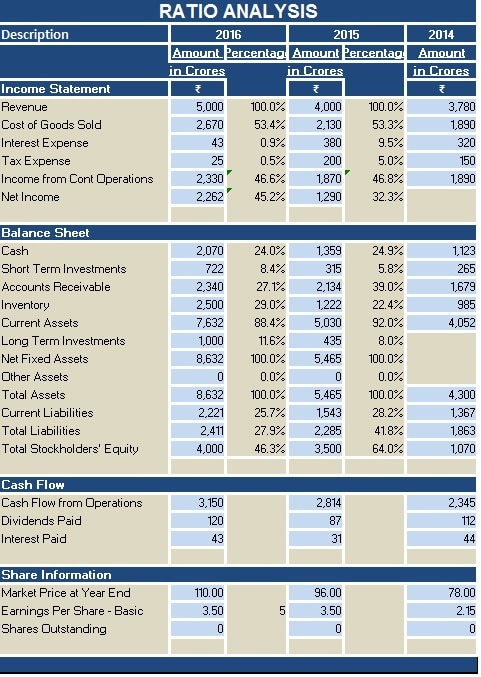
Hence, insert all relevant items from the financial statements. All these data will be helpful in calculating the ratios.
You just need to fill the amounts from the annual report of the company into the blue boxes for all 3 three years. The financial data of 3 years minimum is required for the ratio analysis.
That’s it, and you are ready with the major useful ratios in this template.
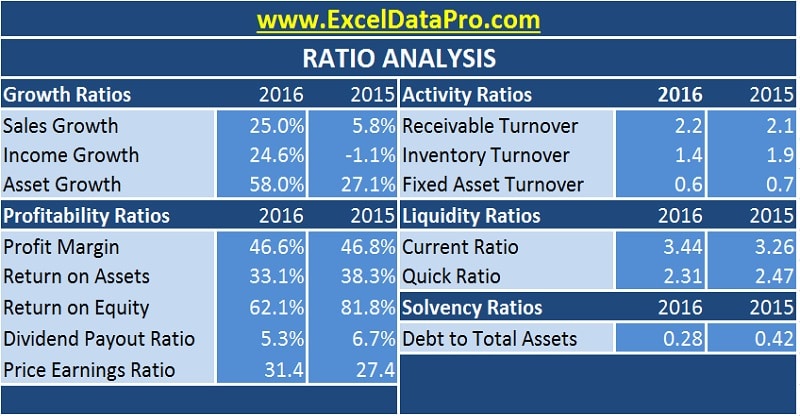
Ratio Analysis Sheet
This sheet consists of 5 major categories of ratios: Growth Ratios, Profitability Ratios, Activity Ratios, Liquidity Ratios, and Solvency Ratios.
Thus, Ratio Analysis Template will simplify your task of analysis. Ratio analysis is a very important component of financial analysis and it gives a clear picture of a company’s financial and operational activities.
Advantages of Ratio Analysis
- Individual investors, owners, finance professionals use these ratios to determine the company’s strengths.
- Normally, an investor primarily requires a basis for estimating the earning capacity of the company.
- Moreover, The creditors/banks and other lending institutions are concerned with the liquidity or the ability to pay interest and redeem loan within a specified period.
- In addition to the above, Management of the company is usually interested in evolving analytical tools to measure costs, efficiency, liquidity, and profitability with a focus to make intelligent decisions.
- It simplifies a company’s financial statements.
- Furthermore, it is helpful in comparing enterprises of similar industries.
Disadvantages of Ratio Analysis
- Not good for comparing enterprises from different industries.
- Sometimes, companies make year-end changes to their financial statements to improve their ratios. In such a scenario, the ratios mean nothing and will mislead the evaluation.
- While performing Ratio analysis, inflation is not taken into consideration. Hence, does not reflect the correct financial situation.
- Ratio analysis focuses on quantitative analysis and not qualitative analysis.
We thank our readers for liking, sharing, and following us on different social media platforms.
If you have any queries please share in the comment section below. I will be more than happy to assist you.
Frequently Asked Questions
How do you calculate the payback period?
The payback period is the estimated number of years to recoup the cash a company invests in a project.
What is financial leverage?
Financial leverage refers to the use of debt to acquire additional assets.
What is a current asset?
A current asset is a company’s all the cash equivalent. These include cash in hand and other assets that a company can convert to cash within one year.
Moreover, many companies have operating cycles for longer than one year. In such cases, those assets which are expected to turn to cash within that period will be considered the current assets.
What is the difference between liability and debt?
The term liability refers to payment obligation arising from operating activities. Whereas the term debt refers to all of the amounts that a company owes. In simple terms, total liabilities.
What is long-term debt?
A long-term debt refers to loans and other liabilities that will not become due within one year.
