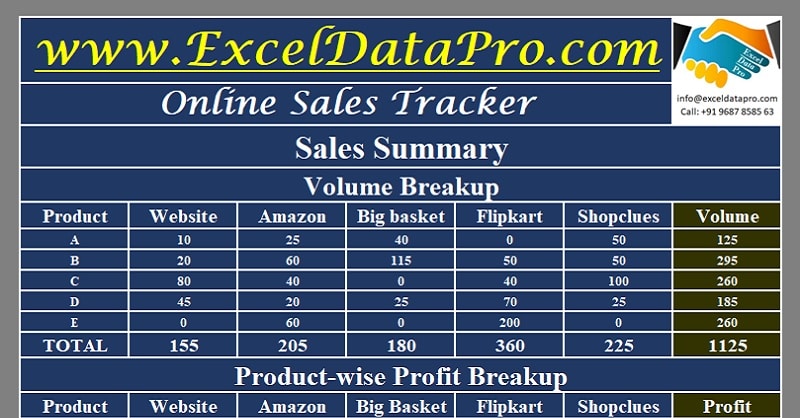
Online Sales Tracker is a ready-to-use excel template to record your monthly sales and analyzes product-wise sales volume and product-wise profit.
You just have to enter your daily sales and it will automatically prepare charts of sales volume and profit made on different sales channels.
This template is helpful for those selling like books, files, themes, clothes, shoes, etc. We must know about how the products are performing on each of our sales channels.
This helps us to take decisions related to purchasing, manufacturing or ordering a particular product. It also helps us to define the distribution of products on different sales channels.
Online Sales Tracker Excel Template
Keeping in mind all the actual requirements of online sellers, we have created an easy-to-use Online sales Tracker Excel Template with predefined formulas.
This template performs analysis of sales. It provides sale of each product made on 5 different sales channels. It further bifurcates the profits made on each product on each sales channel.
Click here to download Online Sales Tracker Excel Template.
You can download other financial analysis templates like ROCE Calculator, ROE Calculator With Dupont Analysis, Portfolio Analysis With BSE Bhav Copy, Income Tax Calculator FY 2018-19 and Loan Amortization Template.
Let us discuss the contents of the template in detail.
Content of Online Sales Tracker Excel Template
This template consists of 3 sheets:
- Product Sheet.
- Monthly Sales Report.
- Online Sales Tracker.
Product Sheet
Insert your product name, cost price and selling price along with your sales channels.

This sheet is used to create a drop-down list of products. It is also used to fetch the selling price and cost price of the product in the Monthly Sales report sheet.
Monthly Sales Report
Monthly Sales Report consists of the following columns:
Date: Insert the date on with the sales takes place.
Day: This column is auto-populated. It will fetch the weekday of that particular date using the TEXT Function
Product: Select the product from the drop-down list.
Quantity: Insert the quantity of goods/services sold.
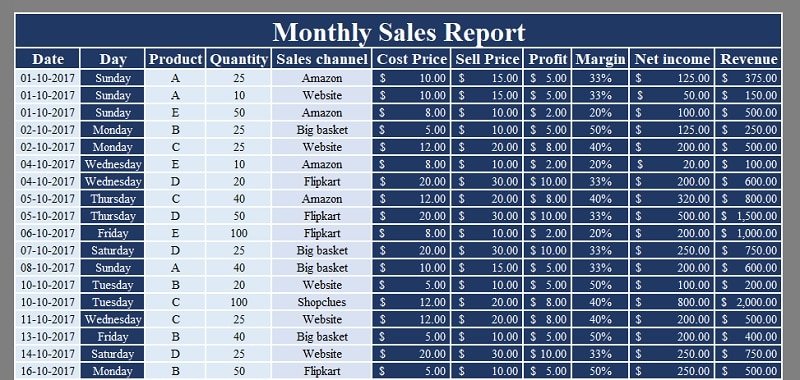
Sales Channel: Select the sales channel on which the sale has taken place.
Cost Price: This field fetches the cost price as entered in the product sheet.
Sell Price: This field also fetches the selling price as entered in the product sheet.
Profit: It calculates the profit amount using the formula Cost Price minus Sales Price.
Margin: This is the profit margin. Using the formulas Profit divided by Selling Price.
Net Income: Net Income is the profit amount multiplied by the number of goods/services sold.
Revenue: Revenue is equal to selling price multiplied by the number of goods/services sold.
In this sheet, you only need to enter 3 data and the rest of all fields will auto-populate.
Online Sales Tracker
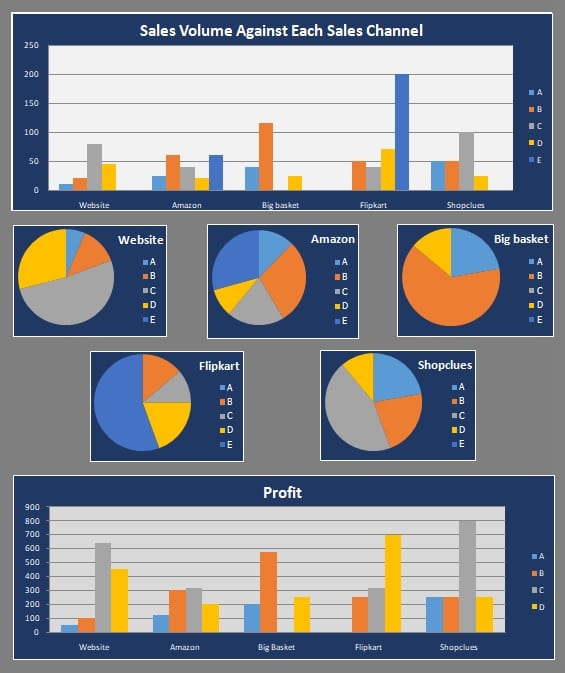
This sheet consists of sales volume analysis and profit analysis for each product made on each sales channel. You don’t have to enter any data here. All the cells will populate based on entries made in the Monthly Sales Report.
Product-wise and Channel-wise Volume Breakup
This section fetches and sums up the data of products sold on each sales channel during the month.

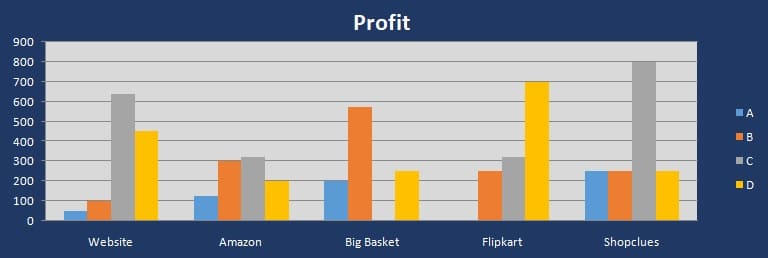
Product-wise and Channel-wise Profit Breakup
The second section fetches the data of channel-wise profits made by each product.

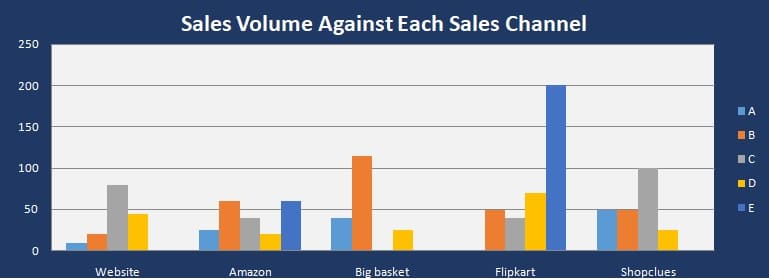
Product-wise Sales Volume Chart
Product-wise and Channel-wise Volume Breakup are displayed in a column chart.
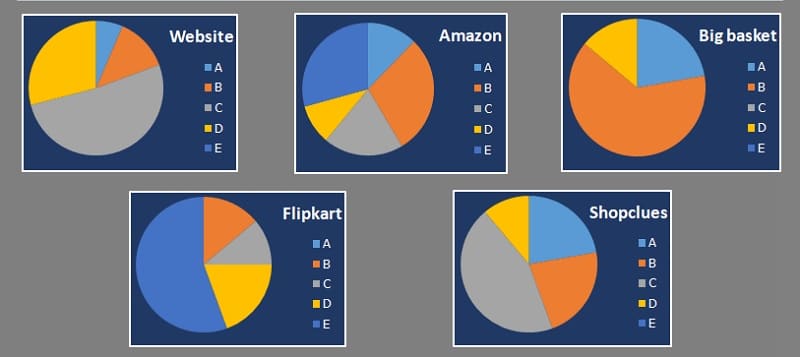
Channel-wise Sales Volume Pie Chart
An individual pie chart for each channel for the percentage of goods/services sold is displayed in this section.
Product-wise Profit Chart
Product-wise and Channel-wise Profit Breakup are displayed in a column chart.
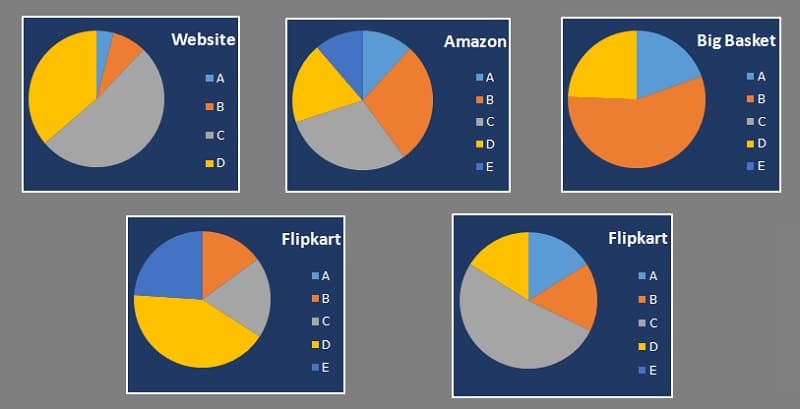
Channel-wise Profit Pie Chart
This section displays an individual pie chart for profits made on each channel.
We thank our readers for liking, sharing and following us on different social media platforms.
If you have any queries please share in the comment section below. We will be more than happy to assist you.
Leave a Reply