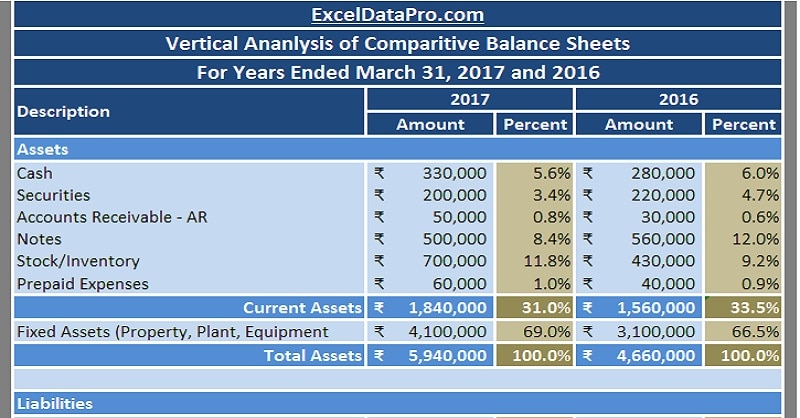
Balance Sheet Vertical Analysis Template is a ready-to-use template in Excel, Google Sheet, and OpenOffice to analyze the relative percentage change over a period.
Thus, just insert the respective amounts of the balance sheet in the light blue columns. The template will automatically do the vertical analysis for you.
This template is useful for conducting the financial analysis of businesses. Accounting professionals, individual investors, and auditors to evaluate the change in Balance sheet figures over some time.
Table of Contents
What Is Vertical Analysis?
Vertical analysis means the vertical evaluation of the Balance sheet and other financial statements in terms of the relative percentage change in line items.
This helps us to understand the contribution of the balance sheets each line item against the resulting figure. Another name for vertical analysis is a common-size analysis. It is one of the popular methods of financial statement analysis.
Usually, the vertical analysis is done for a single period to see the proportionate account balances. But you can also it over several periods to identify changes in accounts over time.
Step To Conduct Vertical Analysis Of A Balance Sheet
While performing Balance sheet Vertical analysis, you need to consider each line item figure from all 3 major sections of the balance sheet. Show each item from assets, liabilities, and shareholder equities as a percentage of the base figure.
Generally, the totals of Asset, Liabilities, and Stockholder’s Equity are considered as base figures. All the individual figures of an asset are shown as a percentage of the total asset amount.
Similarly, individual figures of liabilities and Shareholder’s equity is shown as a percentage of the mutual total of Liabilities and Shareholder’s Equity.
Formula For Vertical Analysis of A Balance Sheet
Percentage = Individual amount/ Base amount.
Where the base amount is the Total of Asset or Mutual Total of Liabilities and Shareholder’s Equity. To increase the usefulness of vertical analysis, you can use multiple years of data for comparative analysis.
Balance Sheet Vertical Analysis Template (Excel, Google Sheet, OpenOffice)
We have created a Balance Sheet Vertical Analysis Template with predefined formulas. IT consists of different categories of Assets, Liabilities, and Shareholder’s Equity. It is free to use and you can also customize it as per your need.

Excel Google Sheets Open Office Calc
Click here to Download All Financial Analysis Excel Templates for ₹299.
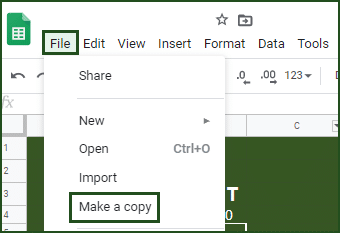
Note: To edit and customize the Google Sheet, save the file on your Google Drive by using the “Make a Copy” option from the File menu.

Additionally, you can download other Financial Analysis templates like Break-Even Analysis Template, Business Net Worth Calculator, and Sales Revenue Analysis Template.
Let us discuss the contents of the template in detail.
Contents of Balance Sheet Vertical Analysis Template
This template consists of 3 major sections: Header Section, Assets Section, and Liabilities and Shareholder’s Equity Section.
The first row consists of Company Name followed by the heading of sheet ” Vertical Analysis of Comparative Balance Sheets along with years of comparison.

Assets
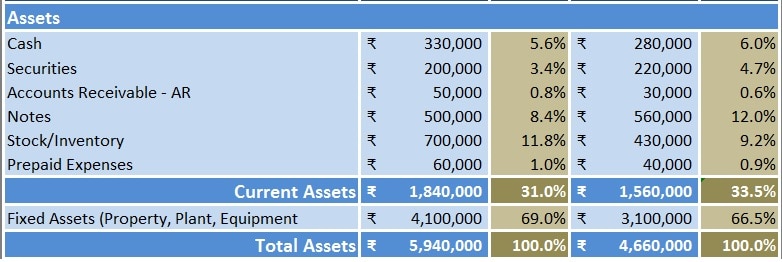
Asset Section consists of the current assets and fixed assets of the company.
Current assets include cash and other cash equivalents like Accounts receivables, securities, inventory, and prepaid expenses.
Fixed assets include property, plant, and equipment.

Total Asset = Current Assets + Fixed Assets
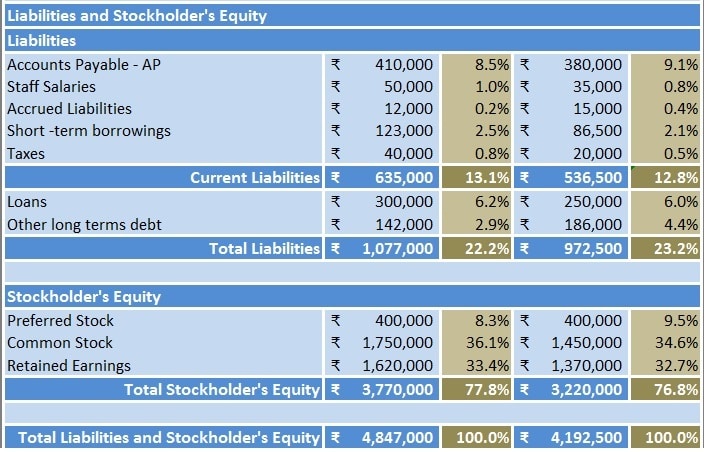
Liabilities and Shareholder’s Equity
a) Liabilities
Liabilities include accounts payable, staff salaries, accrued liabilities, short-term borrowings, and unpaid taxes.

b) Shareholder’s Equity
Shareholder’s Equity includes preferred stock/owners equity, common stock/public Equity, and retained earnings.
The subheading included here are as per the balance sheet data we have taken. It differs from cases to cases. You can add or remove subheadings are per your requirement.
Benefits of Vertical Analysis
- Vertical Analysis helps to see the relative annual changes of a particular business.
- Moreover, it helps the management to closely monitor the company’s financial performance over some time.
- Furthermore, it helps to identify the change in the behaviors of accounts and take action accordingly.
- It helps to understand the correlation between line items as well as the bottom line.
- Such analysis displays the corresponding changes in the finances of a particular project or a company during a specific period or multiple periods.
- It helps us to know the relative trends in the industry.
- You can also easily compare two or more companies of different sizes in the same industry.
Thus, performing vertical analysis helps in many ways, especially when we are planning to invest or buying a business.
We thank our readers for liking, sharing, and following us on different social media platforms.
If you have any queries please share in the comment section below. We will be more than happy to assist you.
Frequently Asked Questions
What is another name for Vertical Analysis?
Another name for vertical analysis is a common-size analysis.
What is the difference between Trend Analysis and Comparative Analysis?
Trend analysis compares the line by line amounts in financial statements over a certain period. Whereas, the Comparative analysis compares financial statements of different years or periods of the company or other companies in the same industry.
Moreover, Trend analysis is always horizontal. Whereas, Comparative analysis can be horizontal or vertical.
Furthermore, the Trend analysis is useful in comparing current financial statements with previous financial years. Whereas, the Comparative analysis is useful to compare both a single company’s results with its previous periods also with other similar companies.
What are the objectives of financial analysis?
The main objective of analyzing the financial statements to understand the trend in movements of finances. Moreover, it helps us to diagnose the financial statements to look for profitability as well as the financial soundness of the firm. Additionally, It is useful to forecast about future prospects of the firm.