
The Sales Revenue Analysis Template is a ready-to-use template in Excel, Google Sheets, and OpenOffice that makes it easy for you to keep track of the fast-moving products in your product line. Apart from that, it will give you product wise profit in % and in terms of revenue.
Table of Contents
What Is Sales Revenue Analysis?
First of all, let us understand some terms associated with Sales and Revenue Analysis.
Revenue refers to the total sales of a firm based on a given quantity of goods. To calculate revenue, you need to multiply the total quantity of goods sold by the price of the goods during a specific period.
Eventually, this analysis of the revenues will help you decide whether to expand product lines or cut them down depending on the profitability. Revenue analysis lets you project present trends into the future.
Similarly, an analysis of your revenues generated from sales enables you to make informed decisions regarding your business strategy.
Importance of Sales Revenue Analysis
Every business aims to achieve its goals and objectives set out by them. For this reason, they need to thoroughly analyze their strengths and weaknesses.
There are many things such as revenue, sales, product line, etc. that a business owner needs to pay attention to. Sales Revenue analysis is one of them. Revenue is the lifeline of business as it is the main source of the cash flow.
Sales Revenue analysis determines many factors such as the costs of production, discontinuance or adding of new products, area-wise sales, etc.
All these help us know which areas of the company need improvement that can increase our revenue. Thus, Revenue is a key variable for analyzing the business performance of a company.
Sales Revenue Analysis Template
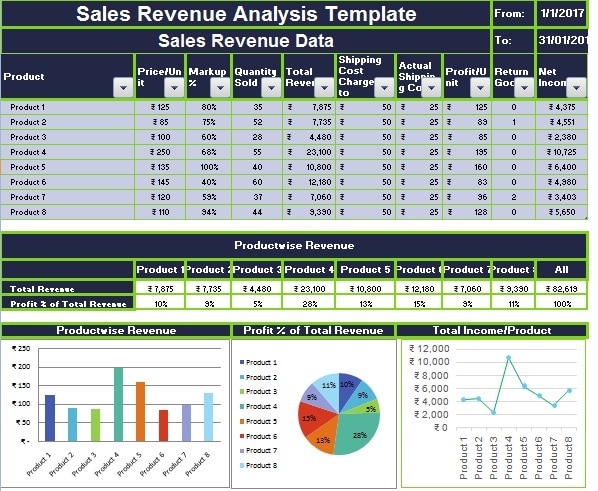
We have created an easy to use Sales Analysis Template with graphical presentations. With the help of this template, you can track additional costs like shipping charges along with returns.
Excel Google Sheets Open Office Calc
Click here to Download All Financial Analysis Excel Templates for ₹299.
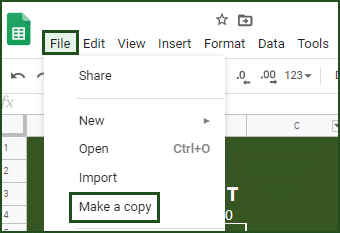
Note: To edit and customize the Google Sheet, save the file on your Google Drive by using the “Make a Copy” option from the File menu.
Additionally, you can download other Financial Analysis templates like Break-Even Analysis Template, Business Net Worth Calculator, Break-Even Analysis Template, and Ratio Analysis Template.
Let’s discuss the template contents in detail.
Content of Sales Revenue Analysis Template
This template consists of four sections:
- Heading and Period
- Sales Data
- Revenue Breakdown in Percentage
- Graphs
Heading Section
The first line of the sheet displays the heading of the template and the starting date of the desired period.
The second line of the sheet displays the subheading of Sales Revenue Data and the end date of the desired period.
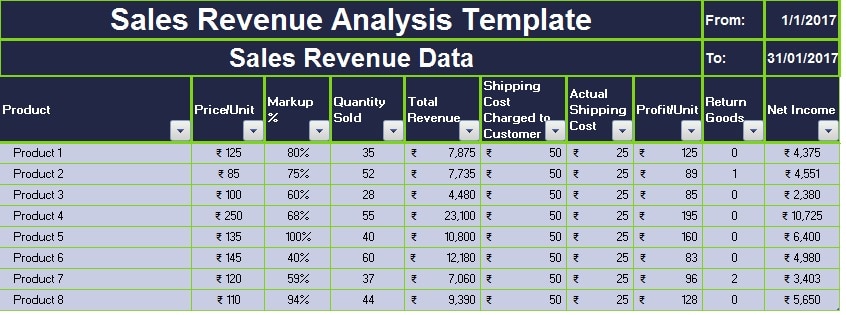
Sales Data Section
This section includes the data input subheadings as follows:
Product: Product Name or Product code.
Price/Unit: Sale Price per Unit.
Markup %: Desired profit percentage per unit.
Quantity Sold: Number of units sold.
Total Revenue: Price per Unit X No of Units Sold X Markup %
Shipping Cost Charged to Customer: The amount which is charged by us to end customer.
Actual Shipping Cost: The amount which we actually pay to the Shipping company.
Profit/Unit: Profit per Unit in terms of revenue. Price per Unit X Markup % + Shipping Cost Charged – Actual Shipping Cost.
Return Goods: Quantity of product returned due to defect or other reason.
Net Income: (Quantity Sold – Return Goods X Price/Unit) + (Return Goods X Actual Shipping)
Revenue Breakdown Section
Revenue Breakdown section consists of a percentage-wise share of each product in total revenue. Thus, the Total revenue of all products / Total Revenue per product.
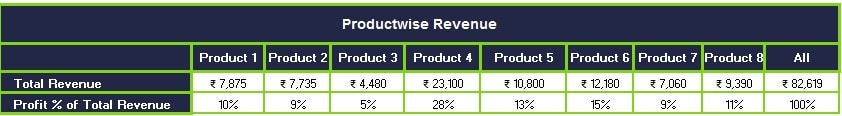
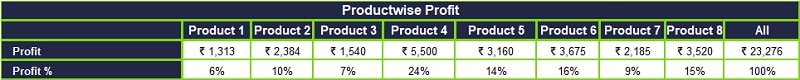
Profit Breakdown Section
The Profit Breakdown section consists of a percentage-wise share of each product in total profit. Total Profit of all products / Total Profit per product.
Graph
In this section, the above data is visually presented in graphical form. There are three different types of graphs representing three types of comparisons.
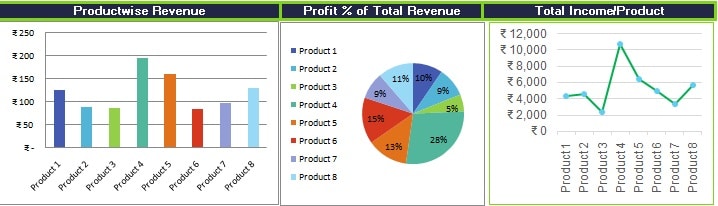
- Product-wise Revenue per product.
- % of Profit per Product.
- Total Revenue per product.
Therefore, analyzing your sales revenue over a period of time enables you to establish sales patterns. It will also assist you in setting sales-related budgets in the future.
Advantages of Sales Revenue Analysis
- It can be an effective tool for marketing and sales teams for achieving and defining targets.
- This analytics can be useful for new startups, online retail sales, or any other small business to track their sales and profits.
- From such analysis, you get insight to improve in areas where products and services aren’t performing well. This helps to make informed decisions.
- Sales Revenue analysis helps us to determine profitability.
- You can design detailed and feasible plans for the future based on these data.
- Moreover, it helps the business to know where to invest and how to invest.
- Design marketing campaigns and allocate an appropriate budget for these activities.
Disadvantages of Sales Revenue Analysis
- Such detailed analytics requires a huge amount of time.
- Future predictions based on these data might be wrong due to a change in political circumstances.
- Performing sales analysis requires detailed knowledge about the product as well as the market conditions.
- The analyzer requires good arithmetic skills and proper market knowledge. Not every salesperson or manager can do this.
We thank our readers for liking, sharing, and following us on different social media platforms, especially Facebook.
If you have any queries or questions, share them in the comments below. We will be more than happy to help you.
Frequently Asked Questions
What are the two types of revenue?
There are two types of revenues: Operating Revenues and Non-Operating Revenues.
Is sales revenue considered as equity?
Yes, when a business earns revenue through sales of products or services, it increases current assets. Moreover, this increases the retained earnings of stockholder’s equity.
Is revenue the same as profit?
No, Revenue is not the same as profit. Revenue is the total amount of cash received against the sale of goods or services. Whereas the Profit is the amount that remains after deducting the cost of goods, packaging, and other sales-related expenses.
What is the Net Revenue Formula?
Net Revenue = Gross Revenue – Directly Related Selling Expenses.
What is the formula for net sales?
Net Sales = Gross Sales – Returns – Allowances – Discounts.
How do we calculate gross profit?
Gross profit is the amount left after deducting the costs which are associated with making/selling goods or the costs associated with providing services.
What is total revenue equal to?
Total revenue is the total receipts a business obtains from selling goods or services. Thus, the price of the goods multiplied by the quantity of the sold goods is total revenue.
