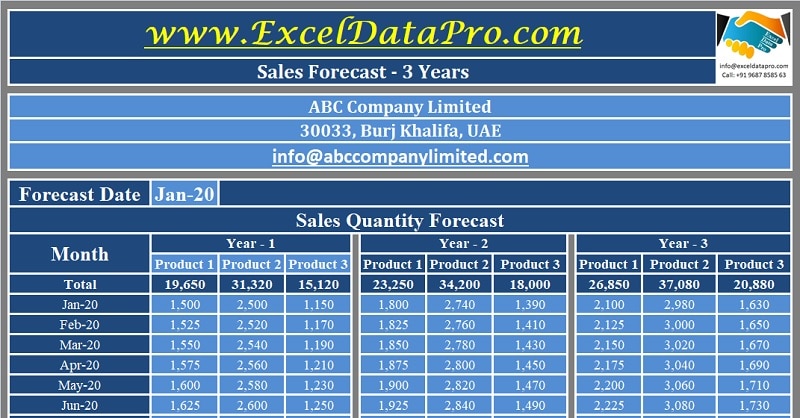
Sales Forecast Template With Charts is a ready-to-use excel template that helps you forecast 3 years sales, growth rate, and profits of your products and services.
In addition to the above, it also consists of a printable version. Moreover, it helps you analyze all year on year forecast data and represents the same in a graphical format.
The purpose of these sales projections is to know the sales of a particular product in the future in a specified market at a specific price.
Proper sales projection plays an important role in any business. It enables the company to produce the required quantity to meet with future demands.
Furthermore, to cope up with production, it helps the company to make pre-arrangements for raw material, labor, etc.
Table of Contents
Sales Forecast Excel Template With Charts
We have created a simple and easy Sales forecast template with charts and predefined formulas. Just enter your product-wise 3-year sales projections and compare them year on year basis.
Click here to download Sales Forecast Excel Template With Charts.
Click here to Download All Sales & Marketing Excel Templates for ₹299.Additionally, you can download other sales templates like Sales Campaign Planner, Sales Lead Follow-up Planner, Online Sales Tracker, Daily Sales Report, Sales Revenue Analysis, Consolidated Annual Sales Report and much more from our website.
Let us understand the contents of this template in detail and how you can efficiently use this template.
Contents of Sales Forecast Excel Template With Charts
This template consists of 3 sheets; Sales Forecast Data Sheet, Printable Sales Forecast, and Sales Forecast Charts.
Sales Forecast Data Sheet
Enter the company’s name, address, and email address. Insert the first date of Jan for the year you want to forecast. For example, you want to forecast for 2020, 2021, and 2022 then enter 1/1/2020 in the light blue cell.
This will automatically display
In this sheet, there are 9 sections: Product-wise Quantity Forecast, Product Price Forecast, Growth Rate Forecast, Revenue Forecast, COGS Forecast, Margin Per Unit Forecast, Gross Profit Forecast, and Profit Percentage Forecast.
Product-wise Quantity Forecast
Enter the product/service name in the first three light blue cells. This will reflect the same in the whole sheet. You can forecast unit sales of three products in this section. Insert unit sales for all three years.
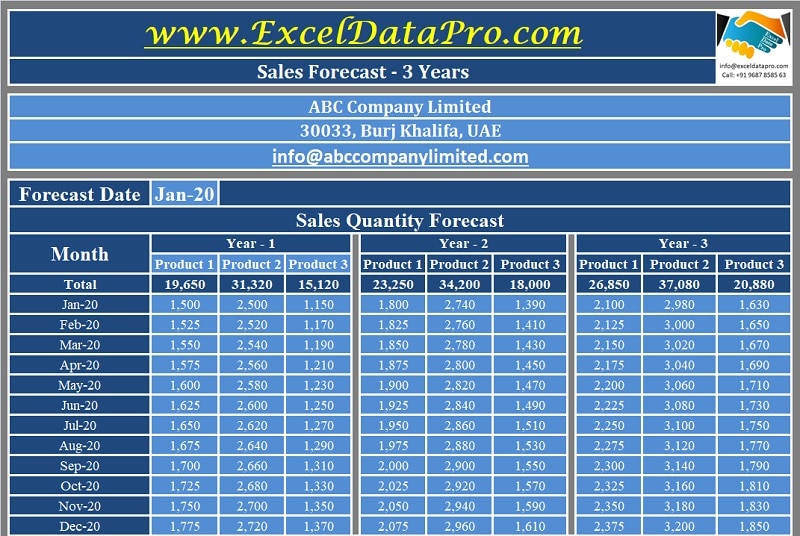
This section displays the yearly total at the top.
Product Price Forecast
Insert the forecast product price for all 3 products for 3 years.
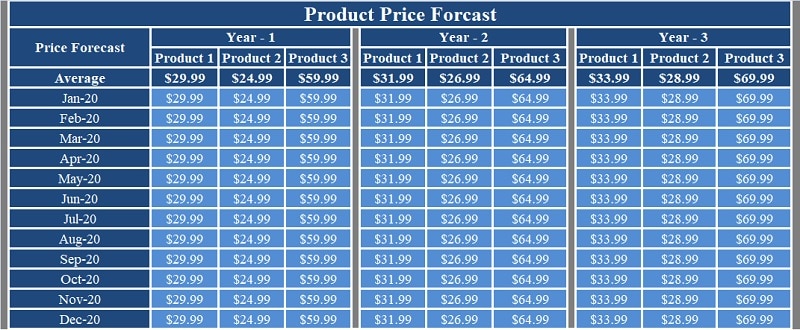
This section displays the Average yearly price at the top.
Growth Rate Forecast
No need to enter any data in this section. It consists of predefined formulas. At the top, it displays the yearly average growth rate. Calculates growth rate month on month. It compares the rate with the previous month.
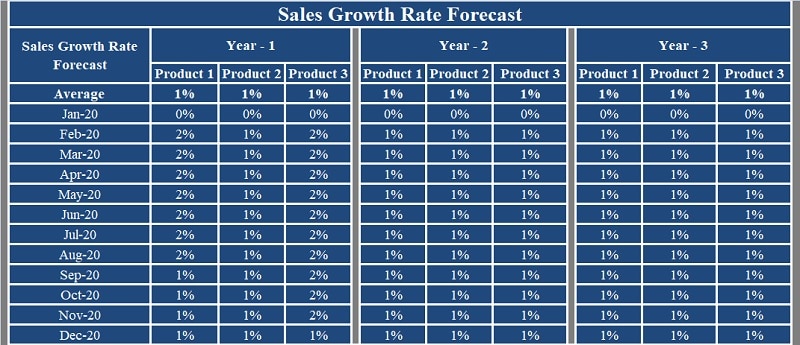
The formula applied here is (Feb – Jan)/Jan).
Revenue Forecast
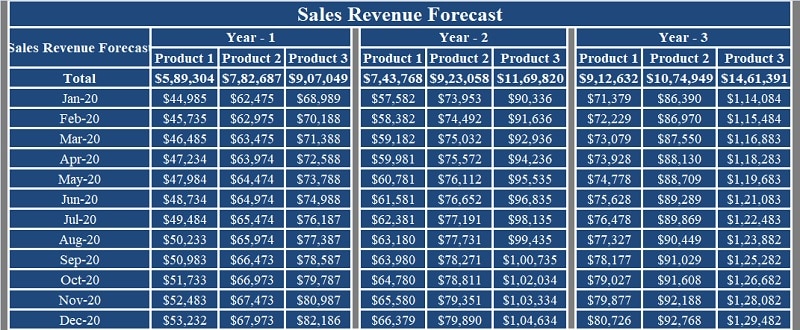
Similar to the above in this section also consists of predefined formulas. In the first row, it displays the yearly total revenue. The formula applied here is the Total sales unit multiplies by the product prices.
COGS Forecast
COGS is the cost of goods sold. Insert COGS month on month for each product for all the three years. This will help you define your profit margin amount per unit in the next section.
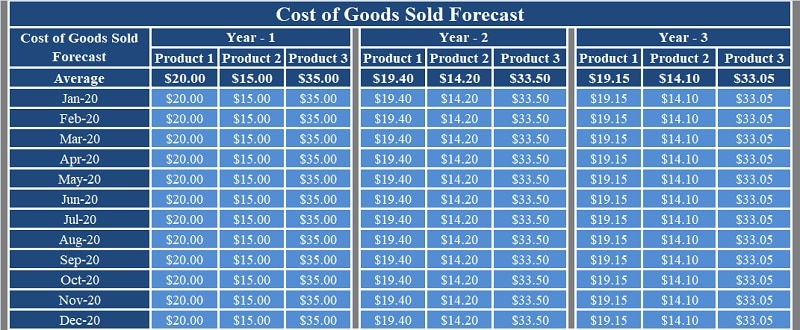
At the top, it displays the yearly average COGS.
Margin Per Unit Forecast
Margin per unit is the Unit price minus COGS. This item is also auto-calculated as it consists of predefined formulas.
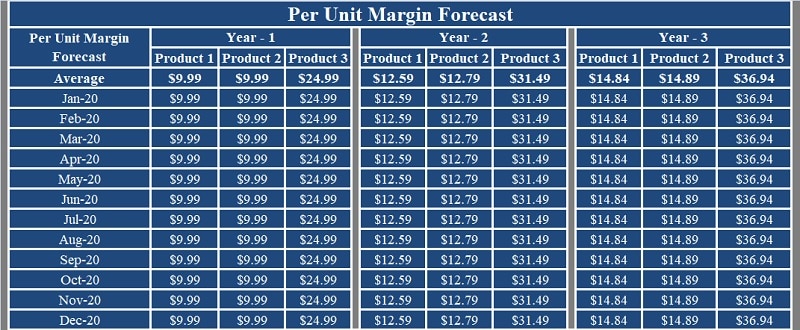
At the top, it displays the yearly average margin per unit.
Gross Profit Forecast
Gross profit is the profit margin per unit multiplied by product quantity sold in the respective period. This section also consists of predefined formulas. Thus, no entry is to be made in this section.
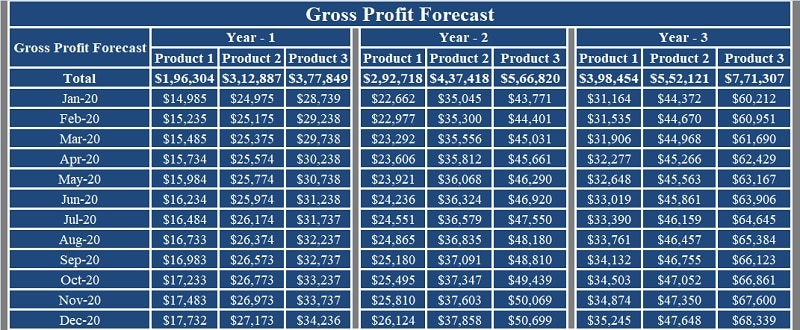
At the top, it displays the yearly total gross profit.
Profit Percentage Forecast
This section displays the profit percentage forecast. The formula applied here is profit divided by revenue multiplied by 100.
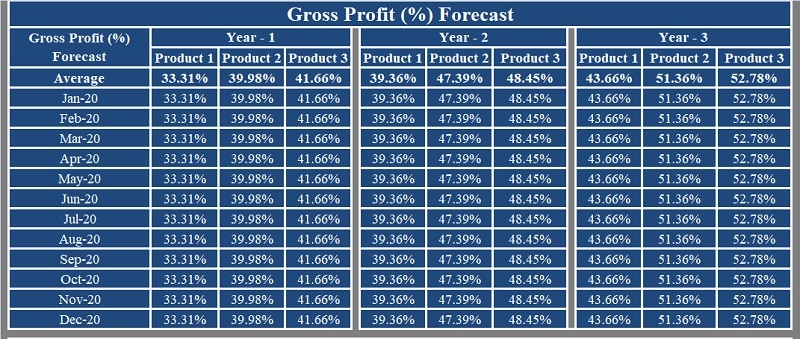
At the top, it displays the yearly average profit percentage.
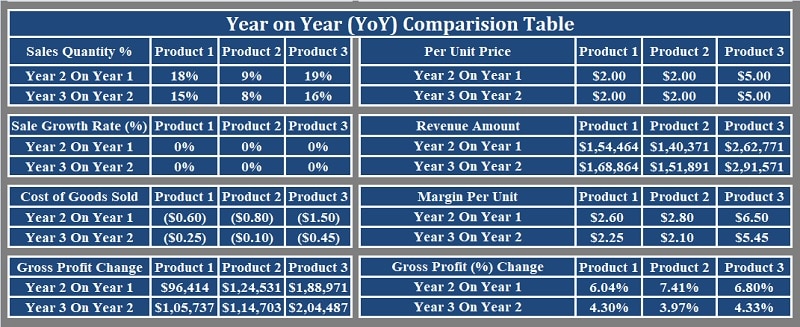
Year On Year Comparison
It compares all the above heads for all three products with the previous year. It shows the increase or decrease compared to other products.
Printable Sales Forecast Sheet
This sheet is the replica of the Forecast sheet. Just the difference is that it is in black and white to save your cartridge. You can print and present the reports to your team leaders and also to the company’s management.
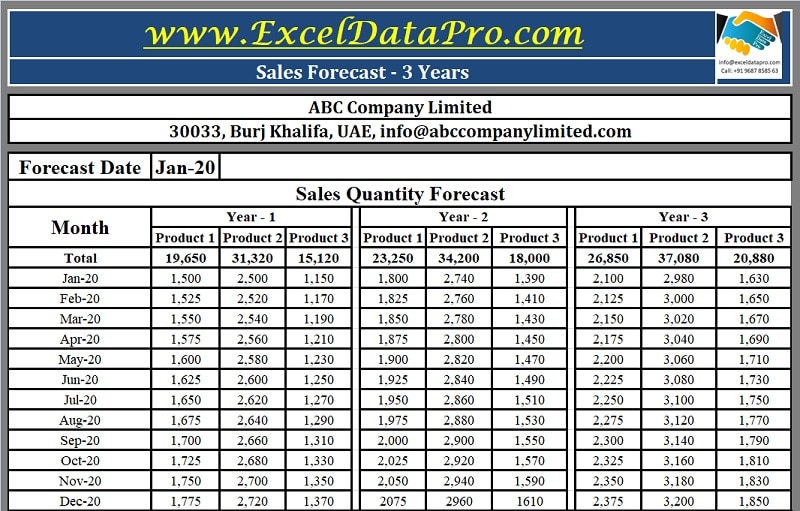
Copy of this can be given to your sales team to keep the focus on projections and inspire them to work accordingly.
Sales Forecast Charts
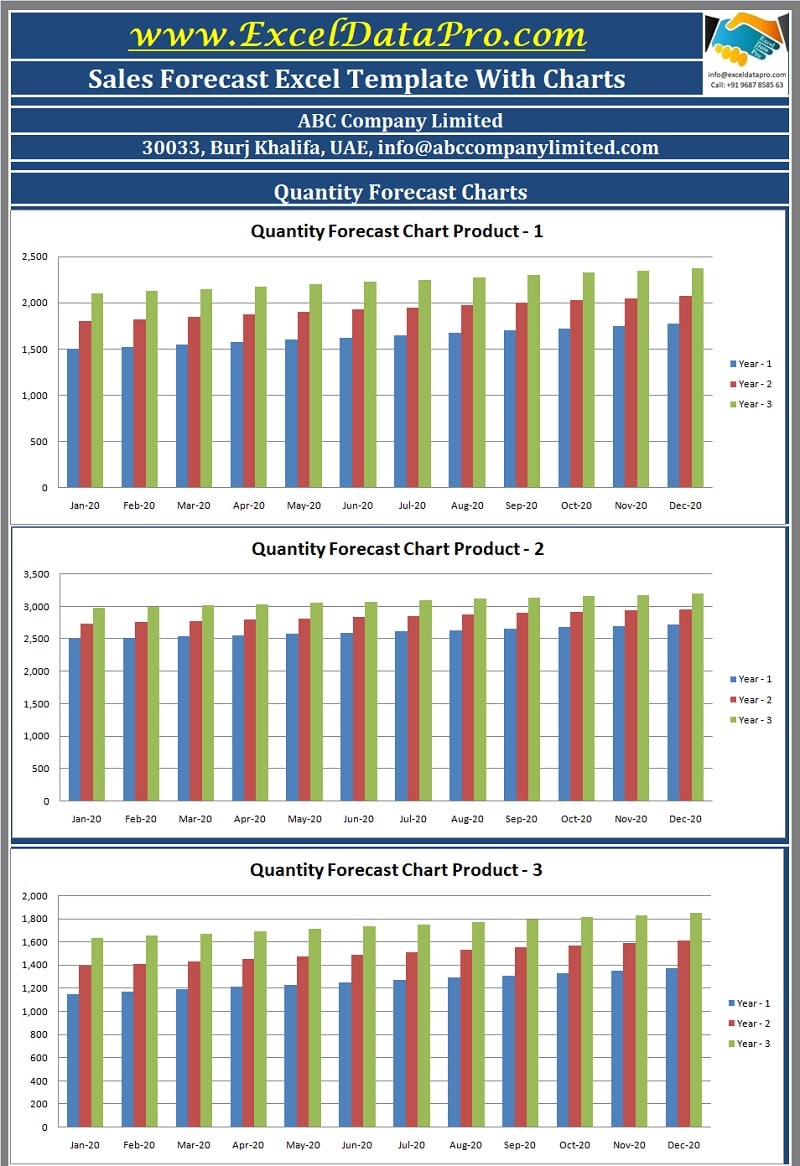
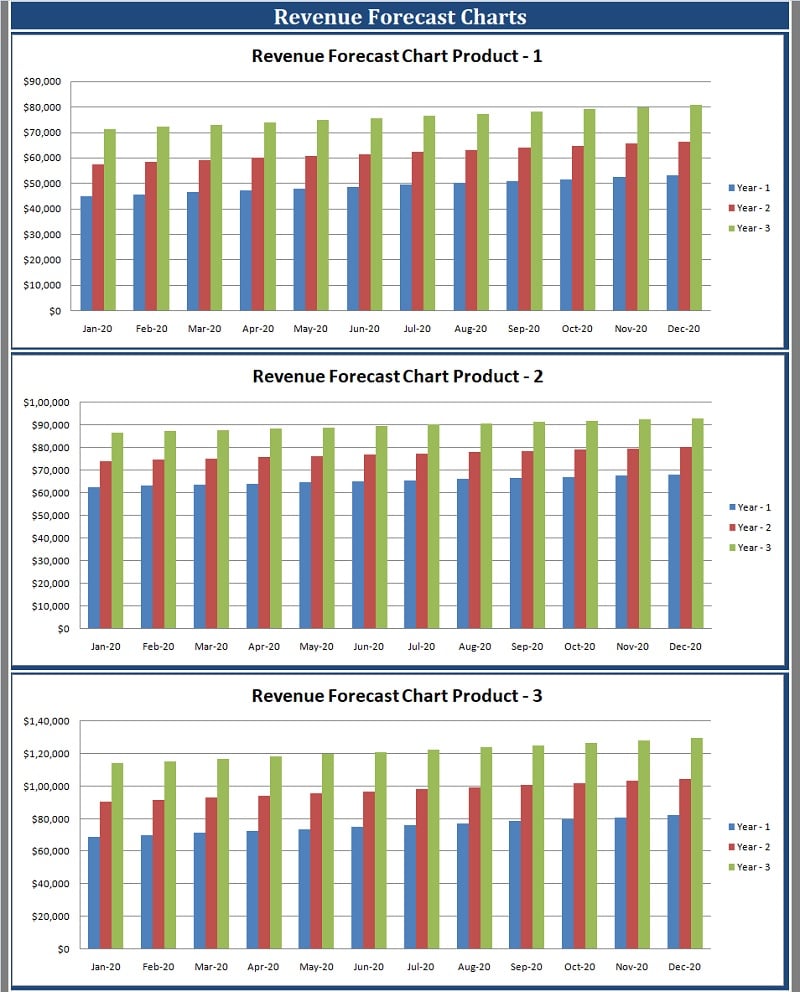
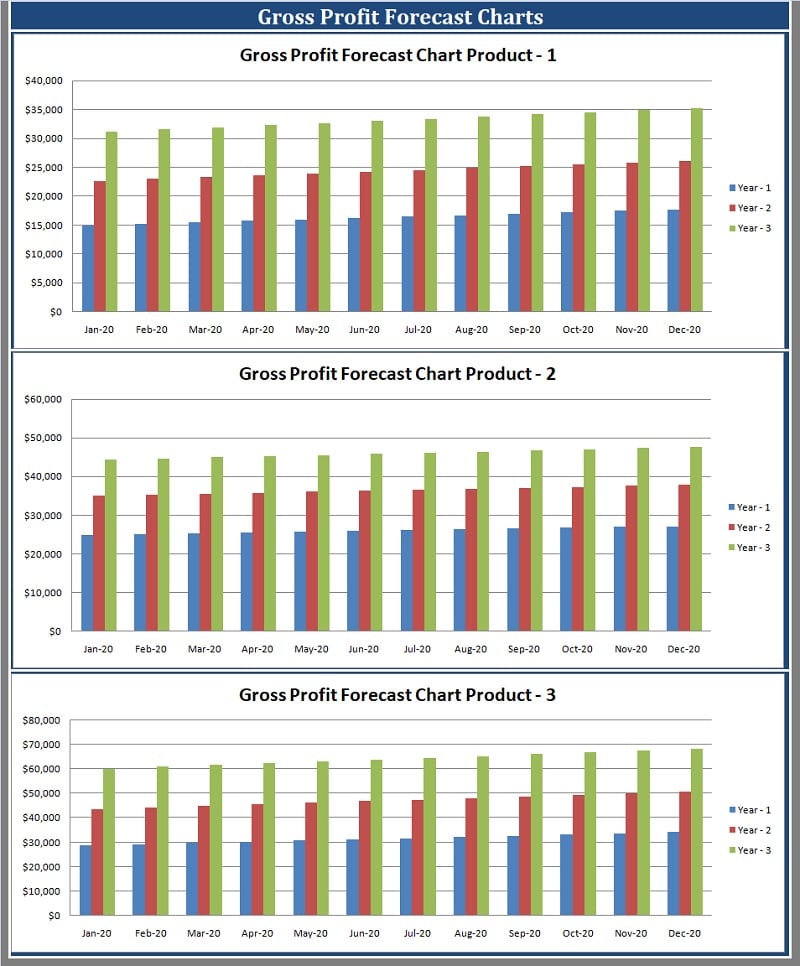
This sheet consists of a graphical representation of the sales forecast data for all 3 products.
It consists of the following 3 sections: Product Quantity Forecast Charts, Revenue Forcast Charts, and Gross Profit Forecast Charts.
Product Quantity Charts
Revenue Charts
Gross Profit Charts
This template can be of great help to sales managers, team leaders and SME owners for 3 year’s Sales Forecast.
We thank our readers for liking, sharing and following us on different social media platforms.
If you have any queries please share in the comment section below. We will be more than happy to assist you.
Leave a Reply