Return on Equity or ROE calculator with DuPont Analysis helps calculate ROE of a company and also perform 3 points DuPont Analysis.
The DuPont Analysis breaks down the ROE of a company into 3 elements and analyzes it. It provides a detailed understanding of the elements contributing to the ROE of a company.
Table of Contents
What is ROE?
ROE stands for Return On Equity. Return on Equity is a measure to evaluate the company’s capacity to generate profits on total equity during a specific period.
In simple terms, it measures how good a company is in earning a profit on money available with a company. For more information click on the link below:
Formula To Calculate ROE
It is calculated by dividing profit earned during the period by shareholders funds/equity.

What is DuPont Analysis?
DuPont Analysis is a technique that analyzes different components of ROE. This analysis helps the investor to know key metrics of financial performance driving ROE.
This analysis is named after The Dupont Corporation who first introduced it.
There are 3 major financial metrics which derive ROE: Margin, Asset Turnover, and Leverage. Breaking down the return on equity into different elements is called DuPont analysis.
It evaluates the component of a company’s ROE. It facilitates the investor to know which financial activities contribute the most to the changes in the company’s ROE.
Usually, investors use this analysis to compare the profit-making efficiency between two firms having similar business activities.
The management uses this analysis to look for key strengths or weaknesses and take decisions accordingly.
DuPont Analysis Formula

Where:
- Margin = Revenue/Sales
- Asset Turnover = Revenue/Total Assets
- Leverage = Total Assets/Equity
Elements of DuPont Analysis
As discussed above 3 elements are contributing to the formation of ROE:
- Profit Margin
- Asset Turnover
- Financial Leverage
1. Profit Margin
Profit Margin is the percentage of profit earned on each rupee of revenue. It is derived by dividing Net Income of a company by total revenue or total sales.
It is the amount in percentage by which revenue exceeds the cost of the business.
Usually, B2C businesses with some niche products have high-profit margins. For example, FMCG businesses with branded products.
Formula to Calculate Profit Margin
Margin = Revenue/Sales
2. Asset Turnover
Asset Turnover ratio refers to sales made on each rupee of the company’s net assets. To calculate Return On Equity Total Asset Turnover Ratio is required.
Asset Turnover Ratio is of various types: Fixed Asset Turnover Ratio, Inventory Turnover Ratio and Total Asset Turnover Ratio.
Formula To Calculate Asset Turnover
Asset Turnover = Revenue/Total Assets
3. Financial Leverage
Financial Leverage refers to the number of assets for each rupee of equity. Companies operating in Banks and the financial services industry generally have high financial leverage.
If the amount of assets on a rupee of equity is high then assets are financed by debt. Hence, higher the financial leverage more is the debt in the capital structure of a company.
Formula To Calculate Financial Leverage
Leverage = Total Assets/Equity
ROE Calculator With DuPont Analysis Excel Template
We have created a ready-to-use ROE Calculator with DuPont Analysis which helps you to calculate ROE and perform DuPont Analysis in just minutes by entering a few amounts.
Click here to download ROE Calculator With DuPont Analysis Excel Template.
You can download other financial analysis templates like Portfolio Analysis With BSE Bhav Copy, Income Tax Calculator FY 2018-19 and Loan Amortization Template.
Let us discuss the contents of the templates in detail.
How To Use ROE Calculator With Dupont Analysis Excel Template?
This template consists of three sections:
- ROE Calculator
- DuPont Analysis (3 Point)
- Time Series DuPont Analysis (5 Years)
ROE Calculator
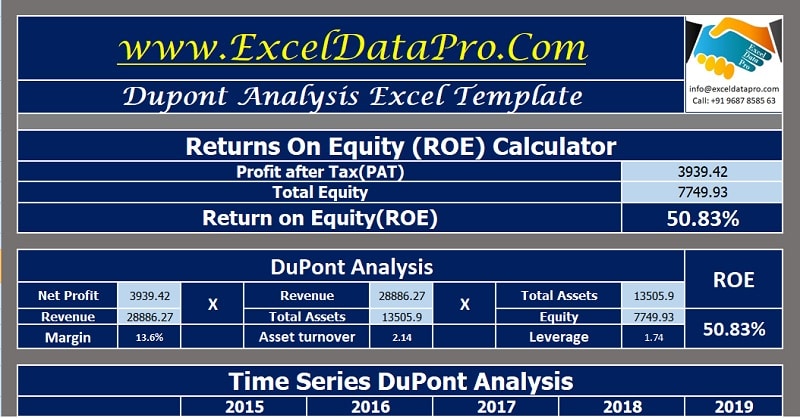
This section consists of a calculator with predefined formulas to calculate ROE. You just need to insert 2 amounts; one from Profit and Loss account and another from Balance Sheet.

Enter profit after tax from P&L and Total Equity from the balance sheet and it will automatically calculate ROE for you.
Dupont Analysis (3 Points)
In this section, you can perform 3 Point DuPont Analysis. You require four figures from financial statements: Net Profit, Revenue (Sales), Total Assets, Total Equity. Insert these figures in light blue cells.

Thus, by applying the above-mentioned formulas for each head it calculates the Margin, Asset Turnover, and the Financial Leverage. This gives you the DuPont Analysis of the companies financials activities.
ROE is derived by multiplying all three figures: Margin, Asset Turnover, and Financial Leverage.
Time series DuPont Analysis And ROE (5 Years)
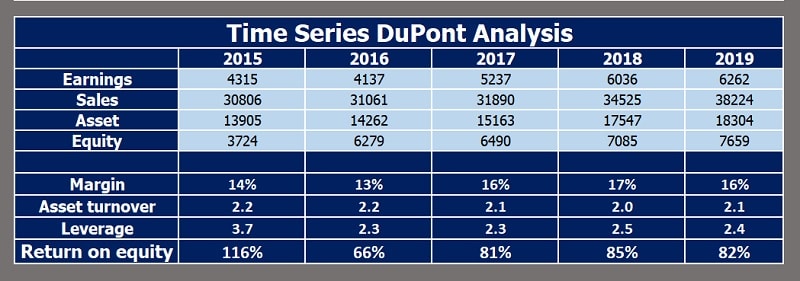
The last section consists of a DuPont Analysis for 5 years of any company. You can analyze the profit-making ability of the company over a specific period with this analysis.

Alike the above section, this section also requires four figures from financial statements. That is Net Profit, Revenue (Sales), Total Assets, and Total Equity.
Enter these 4 figures for all 5 years. It automatically performs the DuPont Analysis and also calculates ROE for all 5 years.
Example of ROE and DuPont Analysis of Page Industries
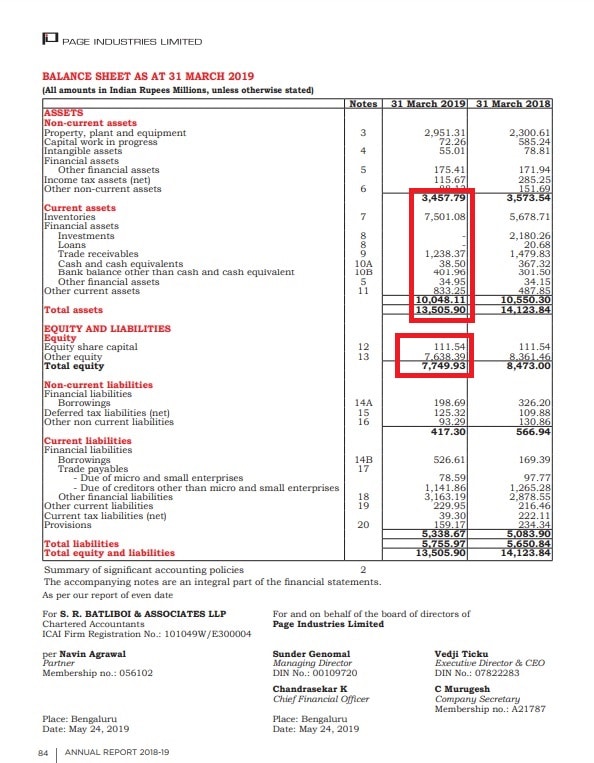
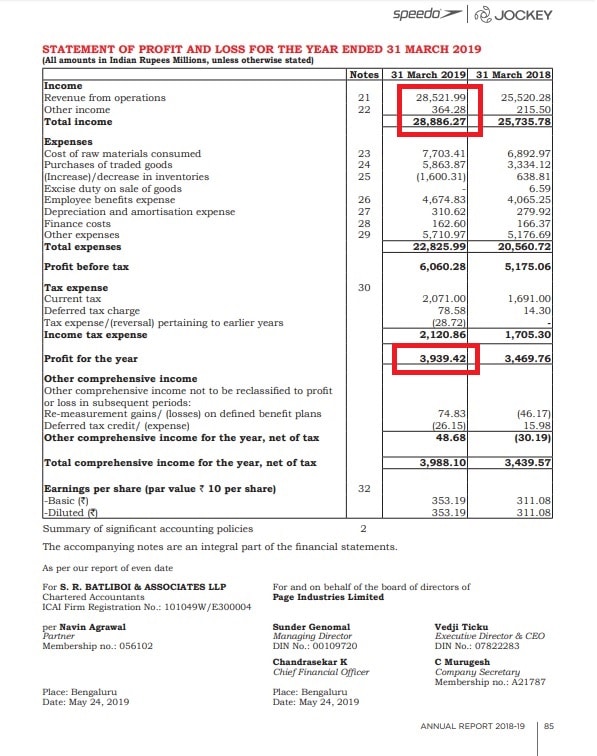
To show you the actual working of the ROE Calculation and DuPont Analysis, we have used the Financial Statements of Page Industries.
Balance Sheet Statement 2019 – Page Industries

Profit and Loss Account 2019 – Page Industries

We have taken the highlighted figures from these statements. Applying the formula it calculates the ROE and performs the DuPont Analysis.

This template can be helpful to those looking to invest money in companies in the share market or even buying a business. It can also be helpful for financial professionals to perform a detailed analysis of companies.
We thank our readers for liking, sharing and following us on different social media platforms.
If you have any queries please share in the comment section below. We will be more than happy to assist you.