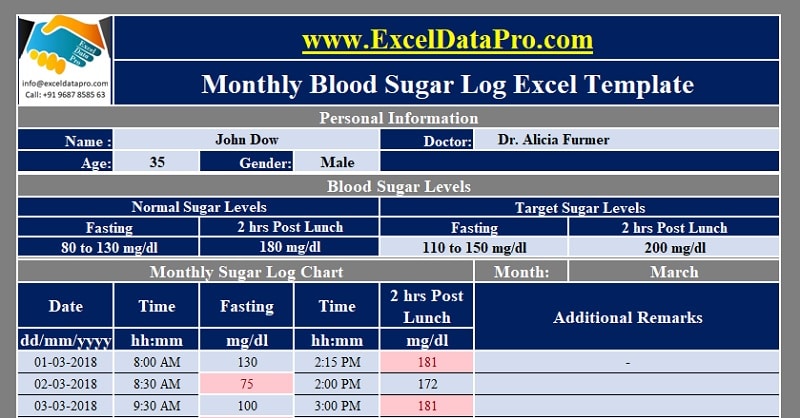
A diabetic patient must maintain a comprehensive log of their blood sugar levels at regular intervals. To facilitate this crucial process, we have developed the Monthly Blood Sugar Log With Charts Excel Template, an innovative solution designed to streamline the monthly tracking of your blood sugar levels.
According to the World Health Organization’s 2016 statistical data, a staggering 422 million adults worldwide are afflicted with diabetes mellitus, a condition that has exhibited a consistent upward trend. This alarming statistic underscores the pressing need for effective monitoring and management tools to combat this global health challenge.
The American Diabetes Association stipulates that the normal fasting blood sugar level, measured before consuming any food or beverages, should range between 80 mg/dl and 130 mg/dl. Conversely, the recommended blood sugar level two hours after a meal should not exceed 180 mg/dl.
For those seeking comprehensive statistical insights into the prevalence and impact of diabetes, the National Diabetes Statistics Report, 2017, published by the Centers for Disease Control and Prevention, serves as an invaluable resource. click on the link below:
National Diabetes Statistics Report, 2017
A patient having blood sugar levels below or above this has to consult a health care physician and take appropriate precautions.
Recognizing the importance of maintaining blood sugar levels within the prescribed range, we have crafted an Excel Template equipped with predefined formulas tailored to this critical task. This user-friendly tool is designed to streamline the monitoring process, enabling users to effortlessly track their blood sugar levels and receive instant visual cues when deviations from the normal range occur.
Click here to download the Monthly Blood Sugar Log Excel Template.
Click here to Download All Health & Fitness Excel Templates for ₹299.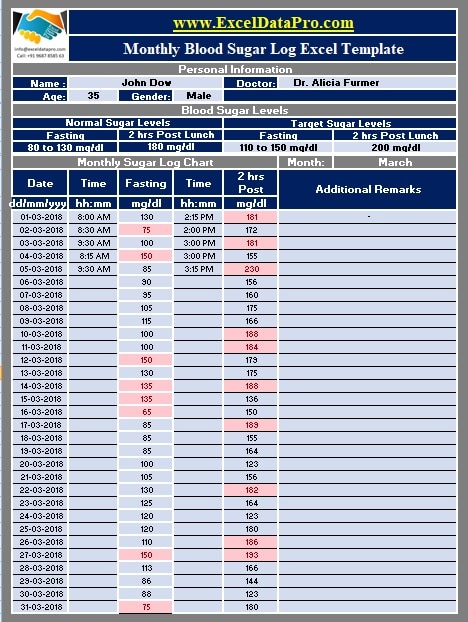
Should your blood sugar levels fall outside the recommended range, our template will automatically highlight the corresponding cell in a conspicuous red color, serving as an immediate visual alert. This feature is particularly beneficial for patients living with diabetes, healthcare professionals, consultants, and caregivers, enabling them to promptly identify and address deviations, thereby facilitating timely intervention and appropriate care.
In addition to that, this template displays the monthly and weekly charts of the data. You can manage data in excel using it on your phone, personal computer, laptop or even in the form of a printable sheet.
You can also download other excel templates like Simple Age Calculator, Daily Work Schedule, and Invoice Template, etc.
Let us discuss the contents of the template in detail.
Contents of Monthly Blood Sugar Log With Charts Excel Template
This template consists of 3 sheets:
- Monthly Blood Sugar Log.
- Monthly and Weekly Blood Sugar Charts.
- Printable Monthly Blood Sugar Log.
1. Monthly Blood Sugar Log
Monthly Blood Sugar Log With Charts Excel Template consists of 3 sections:
- Personal Information
- Sugar Levels (Normal and Targets)
- Datewise Log
1. Personal Information
In this section, you are prompted to enter the patient’s name, age, gender, and the consulting doctor’s name. While the name of the patient, doctor, and age require manual input, the gender can be conveniently selected from a user-friendly drop-down menu.

2. Sugar Levels (Normal and Targets)
As previously mentioned, the normal blood sugar levels for fasting range from 80 mg/dl to 130 mg/dl, while the recommended post-lunch level should not exceed 180 mg/dl. However, it is crucial to note that these values serve as general guidelines, and individuals may have personalized target levels prescribed by their healthcare providers based on their specific circumstances and medical history.

3. Datewise Monthly Blood Sugar Log
Datewise Blood Sugar Log consists of the following columns:
- Date
- Time
- Fasting
- Time
- 2 Hours Post Lunch
- Additional Remarks

Date: Enter the date in the specified dd/mm/yyyy format.
Time: Record the time at which you measured your blood sugar level, adhering to the 24-hour format (e.g., 1:00 PM should be entered as 13:00).
Fasting: This column is dedicated to logging your fasting blood sugar level, which should be measured in the morning before consuming any food or beverages.
Time: In this column, enter the time at which you measured your blood sugar level two hours after your lunch.
2 Hours Post Lunch: Record your blood sugar level measured two hours after consuming your lunch meal.
Additional Remarks: This column provides a space for you to document any additional observations, complications, or symptoms you may have experienced during the monitoring period.
2. Monthly and Weekly Charts
The Chart Sheet consists of 2 sections:
- Monthly Blood Sugar Charts
- Weekly Blood Sugar Charts
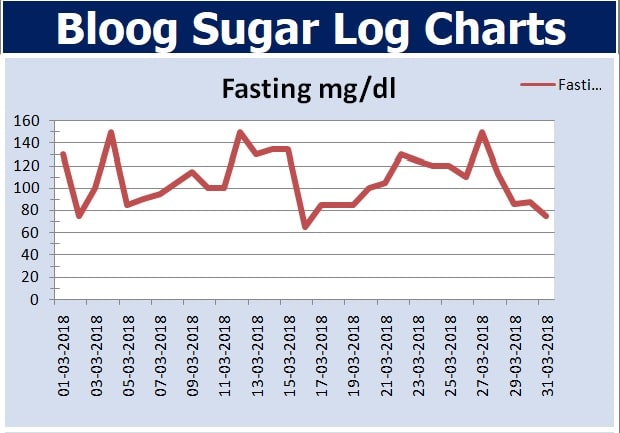
This section displays the charts of data that you enter in the previous sheet monthly. Usually, we monitor blood sugar at two times; one is pre-intake and another is post-intake. It displays the chart for both as shown below:
Monthly Sugar Level Chart – Fasting
This will represent the log data for the whole month from start till end.
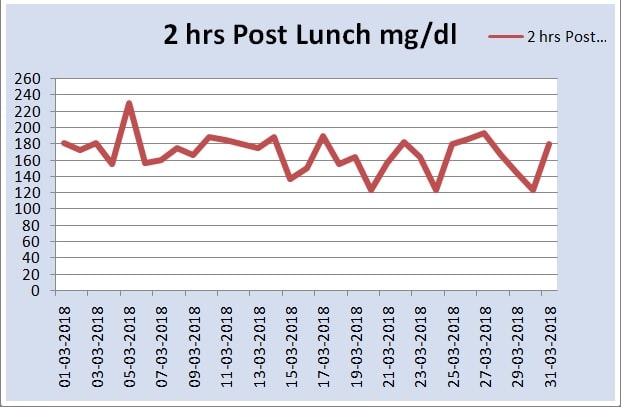
Weekly Sugar Level Chart – Post Lunch
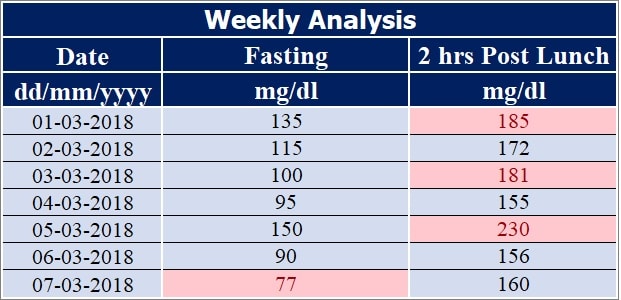
While the monthly charts offer a broad perspective, the weekly section focuses on providing a more granular view of your data. Initially, the chart displays the data for the first week of the month, enabling you to identify potential fluctuations or trends within a shorter timeframe.
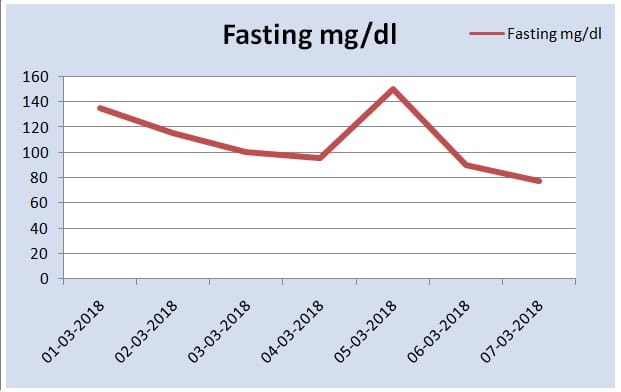
However, you have the flexibility to select and display data for any week of your choosing, simply by copying the relevant data from the Monthly Blood Sugar Log sheet and pasting it into the designated table area.
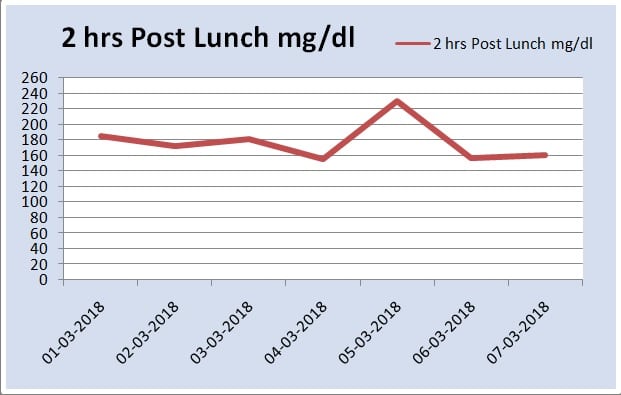
3. Printable Monthly Blood Sugar Log
We recognize that maintaining a digital log may not always be feasible, particularly when you are traveling or engaged in outdoor activities. To address this need, our template includes a dedicated Printable Monthly Blood Sugar Log sheet, offering a convenient solution for manual record-keeping.
All you have to do is just set the print area and print the sheet.
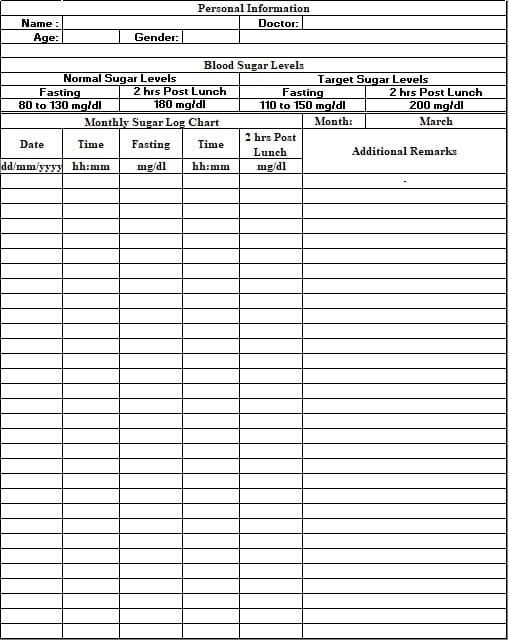
You can carry this sheet with you while you are on travel or outdoors with you and record them. This sheet can be helpful to be presented to your physician while going for regular checkups.
Click below to download Printable PDF:
Printable Monthly Blood Sugar Log
Disclaimer: It is crucial to note that there are three major types of diabetes, each with its unique characteristics and considerations. This template has been designed with a general overview in mind. However, it is strongly recommended that you consult with your Healthcare Professional (HCP) to determine the appropriate normal range for your blood sugar levels and to address any potential complications or specific concerns.
We thank our readers for liking, sharing and following us on different social media platforms.
If you have any queries please share in the comment section below. We will be more than happy to assist you.