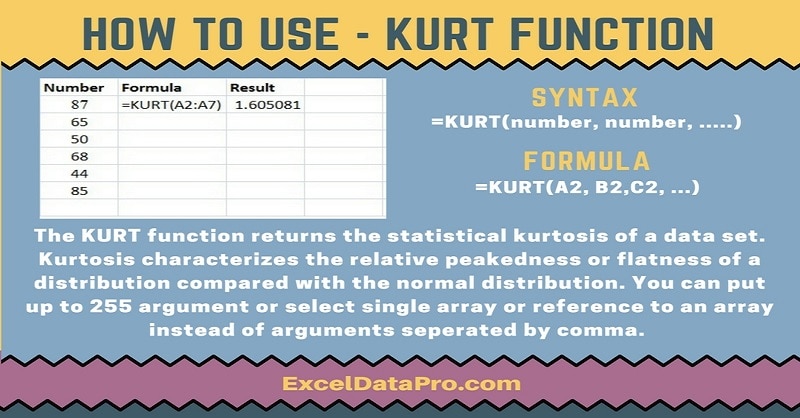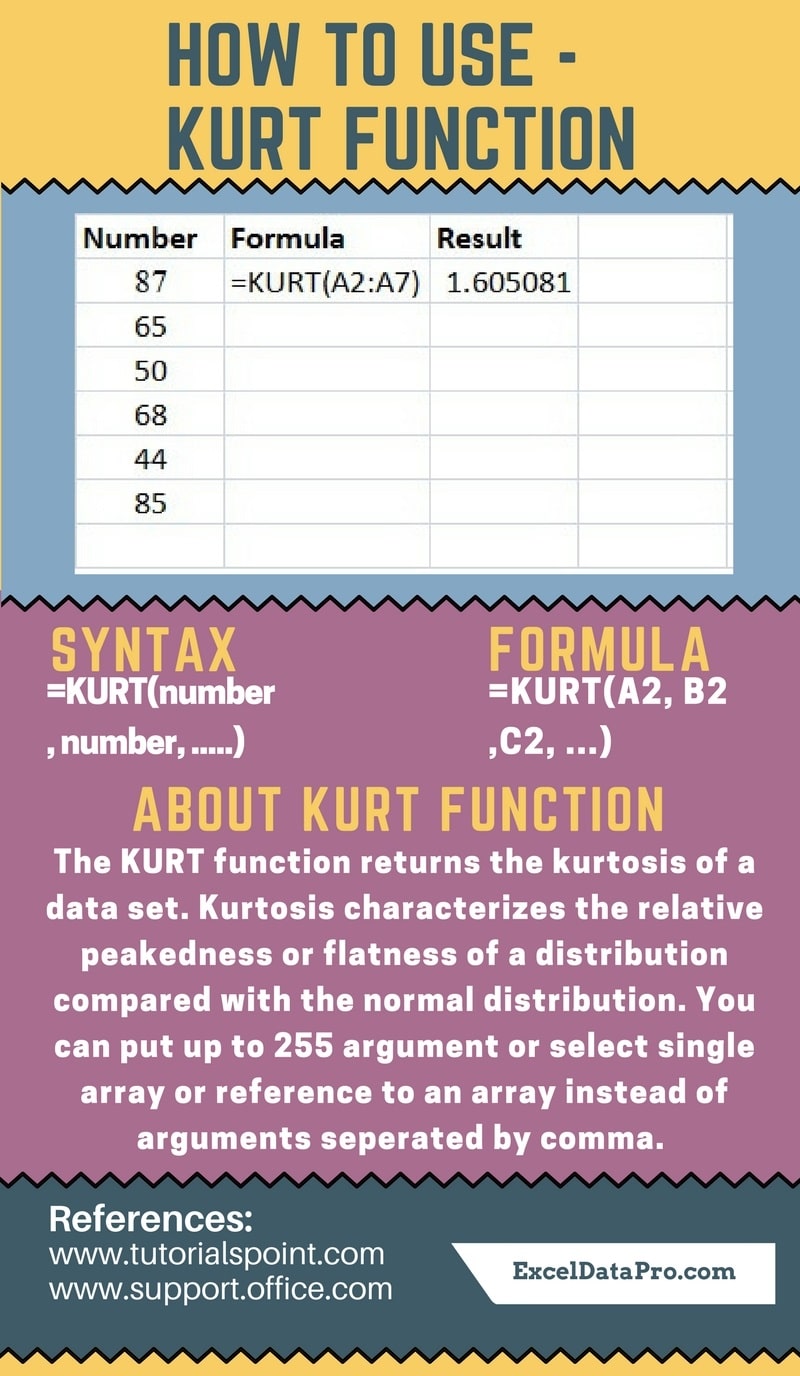
KURT function returns the kurtosis(descriptive statistics) of a data set in Excel. Kurtosis characterizes the relative peakedness or flatness of a distribution compared with the normal distribution.
Kurtosis can be comfortably calculated using the KURT Excel function. The only argument needed for KURT function is the range of cells containing the data or number itself.
The formula for kurtosis can be somewhat tedious to use. Basically, it involves several intermediate calculations.
Excel eases this by providing the KURT Function, which does these intermediate calculations automatically.
Positive kurtosis will indicate a relatively peaked distribution. Negative kurtosis will indicate a relatively flat distribution.
You can find more information about Kurtosis and its formula on the link below:
Syntax for KURT Function
=KURT(number1, [number2], …)
Arguments
Number1, [number2], …: Number1 is required argument. Other subsequent numbers are optional.
You can include up to 255 arguments for which you want to calculate kurtosis. You can also use a single array or a reference to an array instead of arguments separated by commas.
Note: Kurt function can accept up to 255 number arguments in Excel 2007 and later versions. In Excel 2003, the function can only accept up to 30 number arguments.
I have created the infographics for the KURT Function. With the help of these infographics, you can easily learn step by step process for using this excel functions.
Furthermore, Excel consists of many inbuilt functions which are helpful in the analytical and statistical study of number.
Simply follow the instructions in the infographics below:

If logical values and text representations of numbers are typed directly, they are included in the calculations.
The logical values and any text values/text representations of numbers within an array of cells will be ignored.
To learn other function like FLOOR, BASE, and DATE Functions, please click on the name of the function.
Additionally, you can download other accounting templates like Break Even Analysis Template, Sales Revenue Analysis Template and Invoice with GST Template from here.
We thank our readers for liking, sharing and following us on different social media platforms.
If you have any queries please share in the comment section below. I will be more than happy to assist you.