
Break-Even Analysis is a ready-to-use template in Excel, Google Sheets, OpenOffice, and Apple Numbers to calculate financial feasibility for launching a new product or starting new ventures.
The formulas for calculating the break-even point are relatively simple. But, it becomes difficult when it comes up with the projected sales, projecting future sales price, and calculating the fixed and variable costs.
Table of Contents
What is a Break-Even Analysis?
Usually, the Break-Even Point is the number of units you have to sell or the total amount of sales required to cover your costs.
It can also be defined as the point at which an investment will start generating positive returns. Hence, you can consider the point when Total Cost equals Total Revenue.
You can also use break-even analysis to calculate the Payback Period or the amount of time required to break even.
What is Break-Even Point (BEP)?
Break-Even Point means to calculate financial feasibility for launching a new product or starting new ventures.
Usually, the Breakeven Point (BEP) is the number of units the business needs to sell or the total amount of sales to be made in order to cover your costs.
It is the point at which a business starts generating profits. Hence, you can consider it the point at which Total Cost equals Total Revenue.
The calculation of a breakeven point (BEP) is based on the linear Cost-Volume-Profit (CVP) Model. It is a practical tool for simplified calculations and short-term projections.
All types of break-even analysis are based on the basic equation mentioned below.
Formula To Calculate Break-Even Point
Total Cost (TC) = Total Revenue (TR).
TC = Total Fixed Cost (TFC) + Total Variable Cost (TVC).
TR = Selling Price Per Unit (P) X No. of Units Produced and sold (X).
P-V = Contribution Margin per unit (CM).
CMR = Contribution Margin Ratio = (P – V) / P.
Breakeven point can be found in two ways; first in terms of physical units and second in terms of sales/revenue.
How To Find BEP In Terms Of Physical Units?
This method is preferred by manufacturing units. Here BEP will be the number of units sold to cover all the fixed and variable expenses of production.
At this point, a firm neither makes any losses nor makes any profit. It is the meeting point of the revenue and cost curves.
Formula:
Breakeven Point = Total Fixed Costs / Contribution Margin
Contribution Margin = Sales Price – Average Variable Cost
Example – BEP In Terms Of Physical Units
For example, the fixed cost of a manufacturing unit is Rs. 100,000. The Selling Price is Rs. 700 and the variable cost is Rs. 300.
Applying the above formula calculations will be as below:
BEP = Rs. 100,000 / (700-300) = Rs. 100,000 / 400 = 250 units
Thus, the company needs to sell 250 units to reach the Breakeven point.
How To Find BEP In Terms of Sales/Revenue?
Firms with multiple products firms cannot measure the BEP in terms of units. It is convenient for them to find BEP in terms of the total amount of sales/Revenue.
The contribution margin (sales value—variable costs) would be equal to fixed costs. Hence, the contribution margin is expressed as a ratio to sales.
Formula:
Breakeven Point = Total Fixed Costs / Contribution Ratio
Contribution Ratio = Total Revenue – (Variable Cost/Total Revenue)
The formulas for calculating the break-even point are relatively simple. But, it becomes difficult when it comes up with the projected sales, projecting future sales price, and calculating the fixed and variable costs.
Break-Even Analysis Template (Excel, Google Sheet, OpenOffice, Apple Numbers)
We have created an easy to use Break-Even Analysis Template with preset formulas. Just, you need to input your fixed and variable costs and it will calculate the amount you need to sell, in the number of units/revenue, to break even.
This analytical template would be useful for new startups, online retail sales, or any other small businesses.
Excel Google Sheets Open Office Calc Apple Numbers
Click here to Download All Financial Analysis Excel Templates for ₹299.
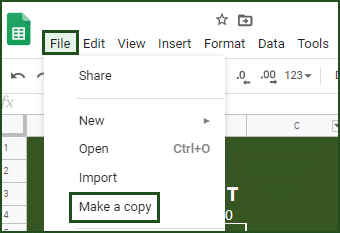
Important Note: To edit and customize the Google Sheet, save the file on your Google Drive by using the “Make a Copy” option from the File menu.
Additionally, you can download other accounting templates like Ratio Analysis Template, ROCE Calculator, ROE Calculator With DuPont Analysis, and Online Sales Tracker Excel Template
Let’s discuss the template contents in detail.
Content of Break-Even Analysis Template
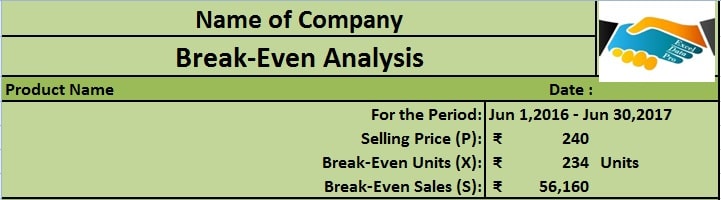
This template consists of 3 sections: Break-Even Point Calculations, Fixed costs, and Variable Costs.
Break-Even Point section, you need to enter only the duration and the price per unit.
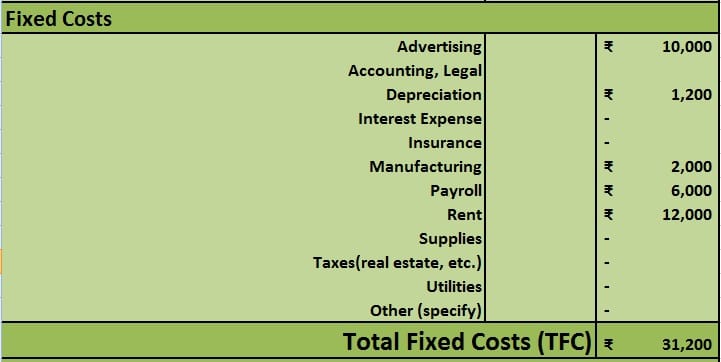
In the Fixed cost section, enter all the relevant to the product.
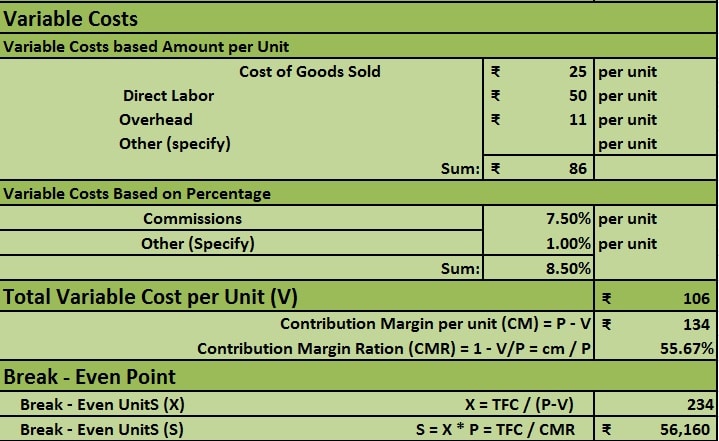
In the Variable cost section, enter all the variable costs relevant to the product.
Note: Please scroll below for all the relevant terms and definitions.
The calculation of a breakeven point (BEP) is based on the linear Cost-Volume-Profit (CVP) Model. It is a practical tool for simplified calculations and short-term projections.
All types of break-even analyses are based on the basic equation mentioned below.
Break-Even Equation
Total Cost (TC) = Total Revenue (TR).
TC = Total Fixed Cost (TFC) + Total Variable Cost (TVC).
TR = Selling Price Per Unit (P) X No. of Units Produced and sold (X).
P-V = Contribution Margin per unit (CM).
CMR = Contribution Margin Ratio = (P – V) / P.
Payback Period
The Payback Period is the time it will take to break even on your investment.
Sales Price
You need to enter the projected or current price of the unit on which it is sold. Mostly, the Sales Price per unit (P) remains constant. So, the total revenue equals the price (P) multiplied by the number of units sold (X).
Variable Costs
Variable costs include production, direct labor, materials, and other expenses which depend on the number of units produced and sold.
Fixed Costs
Fixed costs mean the assumed costs which will remain constant during the specified payback period and do not depend on the number of units produced. It includes costs like advertising, insurance, real estate taxes, rent, accounting fees, and supplies, etc.
Conducting a break-even analysis is important for discovering when your business will be able to cover all expenses and begin to make a profit.
This template will help to determine the sales revenue needed to cover all startup costs and ongoing expenses and hit your break-even point.
Benefits of Performing Break-Even Analysis
- Usually, fixed costs are neglected in price. Hence, performing BEA will help us price smarter. The price factor is important when it comes to market capture.
- Moreover, it saves us to cover surprising expenses often neglected.
- Furthermore, it is a helpful tool in defining your sales targets.
- It also helps to limit the financial strain. It portraits the feasibility of the business whether it is good or bad.
- This document also serves as an important document for any business plan. It allows investors or lending institutions to know your business well.
Limitations of Break-Even Analysis
- Most importantly, it does not predict the demand for the product.
- The accuracy depends on the data provided. If you predict the variable costs wrongly then it doesn’t show actual analysis.
- It becomes a hectic job for businesses having multiple products with multiple prices as they need to do it on an individual product basis.
- BEA ignores time. The costs variate based on economical changes.
We thank our readers for liking, sharing, and following us on different social media platforms.
If you have any queries please share in the comment section below. We will be more than happy to assist you.
Frequently Asked Questions
What is the formula for a fixed cost?
To derive fixed cost multiply the variable cost of production per unit with the number of units produced. Then Subtract the result from the total cost of production.
Is break-even good or bad?
For any business, Break-even means that the business has as much money coming in as much is going out. Hence, it is good to have a break-even. But to reach the break-even time factor should be considered.
What do you mean by the average variable cost?
To derive average variable cost, divide the variable costs such as labor, electricity, etc by the quantity of output produced.
What is the break-even price in the call option trading?
In options trading, break-even is the price of the stock in which the investor chooses to dispose of the contract without making a loss.
Is Depreciation a fixed cost?
Yes, depreciation is a fixed cost and is recorded as an indirect expense. Businesses prepare a depreciation schedule for their asset.