Profit and Loss Account Template is a ready-to-use template in Excel, Google Sheet, and OpenOffice Calc that helps you prepare your Income Statement within minutes.
Furthermore, It enables you to summarize the revenues, costs, and expenses that a company incurs a specified period. Usually, companies prepare this statement quarterly and yearly, and sometimes even monthly.
Table of Contents
What is a Profit And Loss Account?
Profit and Loss Account is the first financial statement prepared before preparing the Balance Sheet. It is also known as the P&L account or Income Statement.
The Income Statement provides a complete summary of revenue generated and expenses incurred by a company, which in turn gives an insight into a company’s financials. It helps us to define whether the company is making profits or incurring losses.
In simple terms, the profit and loss statement provides a detailed look into the financial health of a company during the accounting year.
Methods To Prepare Profit And Loss Account
You can prepare the Profit and Loss Account or Income Statement by two methods:
- Single Step Statement
- Multiple-Step Statement.
Single-Step Method
Generally, small companies prepare the Income Statement using the Single Step statement. It is a simple method and widely used.
In this method, you just take the total amount of Revenues and subtract them from the total expenses to find the gain or loss made by any business.
The formula to calculate Profit/Loss by Single-step method is as follows:
Net Revenues – Total Expenses = Net Profit or Loss.
Multiple-Step Method
Big volume companies use a Multi-Step method. To prepare this statement, you need to follow the following steps:
- Calculate gross profit.
- Make a total of Operating expenses.
- Deduct them from the gross profit.
- You will get the income from operating activities.
- Deduct Expenses from Income from operations. This is your Earnings Before Investments & Taxes.
- The final step is to deduct taxes.
- This gives you the net income/loss for the period.
The formula to calculate Profit/Loss by Multiple-Step Method is as follows:
Revenues – Expenses – Taxes = Net Profit or Loss
Where:
Revenues = Sales Revenue – Sales Returns + Service Revenue + Interest Revenue + Other Revenue
Expenses = All operating expenses + Cost of goods sold + Research and Development + Salaries and Wages + Software + Travel + Utilities + Web Hosting and Domains + Other Expenses.
Purpose of preparing Profit and Loss Account
- It provides a brief understanding of the financial health of a company.
- It helps to project revenues.
- Forecast Expenditures.
- Compare actual performance with projection.
- Maintain provision and reserves depending on the financial health of the company.
Profit and Loss Account Template
We have created an easy-to-use Profit and Loss Account Template by grouping all revenue and expenses with predefined formulas. Just insert the respective amounts in the cells and it will automatically calculate profit or loss for your company.
This template can be useful for businesses of all sizes. It can be helpful to accounting professionals, audit supervisors, account managers, etc.
You can use this template to prepare the monthly as well as yearly P&L Statements for your company.
Excel Google Sheets Open Office Calc Apple Numbers
Click here to Download All Financial Statement Excel Templates for ₹299.
Important Note: To edit and customize the Google Sheet, save the file on your Google Drive by using the “Make a Copy” option from the File menu.
Apart from that, you can download other Financial Statement templates from our websites like Cash Flow Statement, Bank Reconciliation Statement and Trial Balance, etc.
Let’s discuss the template in detail.
Content of Profit and Loss Account Template
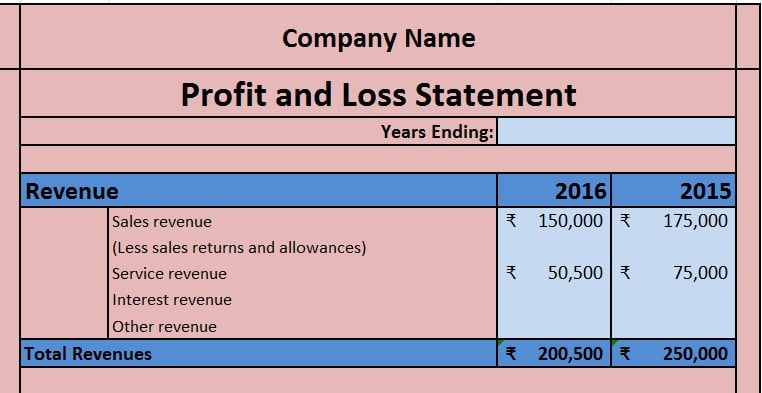
The top section consists heading of the sheet and the period for which it is prepared. This template consists of the following 3 sections: Revenues, Expenses, and Taxes & Summary.
Revenues
Under the Revenue section, insert all kinds of revenues generated by the company. These revenues include Sales Revenue, Service Revenue, Interest Revenue, etc.
Note: Please enter the net sales revenue amount after deducting sales return and other discounts offered during sales if any.
There are two columns for the amount. One is for the current year and the other for the previous year. This helps you to do a comparative study. It also helps to identify the reasons for higher expenses and fewer profits or even losses.
If the comparison with the past year is not required you can leave it blank. Please see the screenshot below:
Insert the amount in the respective cells against the type of revenue. The sum of all revenues generated from different sources is made using the SUM Function.
The formula applied here is =SUM(E8: E12)
Expenses
Under the Expenses section, enter all kinds of expenses that your company incurs. These include expenses like advertising, COGS, depreciation, utilities, employee expenses, rent, etc.
See the image below:
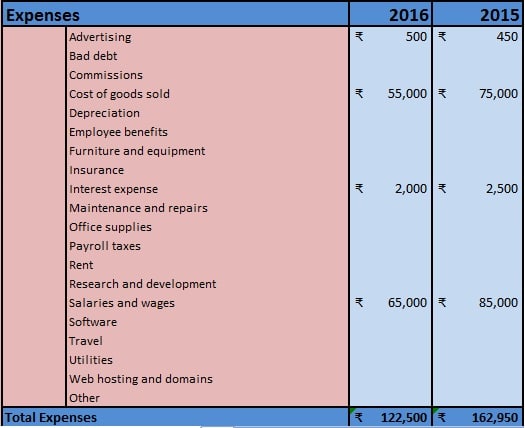
Similar to the revenue section, using SUM function the total of expenses this line shows the total of both the years.
The formula applied here is =SUM(E16: E35)
Summary & Taxes
This section consists of fo two things: Gross Profit Before Taxes and the Income-tax.
Gross Profit = Total Revenues – Total Expenses
The formula applied here is =E13-E36.
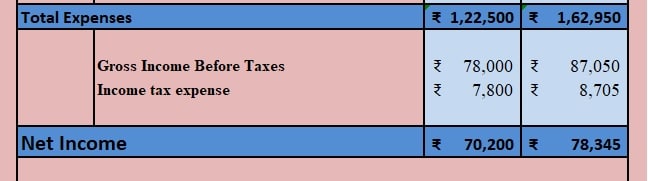
Every company pays income tax. Insert the actual amount of Income tax expense. The formula applied here is =E38*10%. You can change the percentage according to your requirements.
Finally, Net Income is calculated using the following formula:
Gross income – taxes = Net Income. The formula applied here is =E38-E39.
If revenues are higher than the expenses, it is a profit. But when revenue is lower than the expenses then there is a loss. The statement will reflect the amount of loss in the negative.
Content of Monthly Profit and Loss Account Template
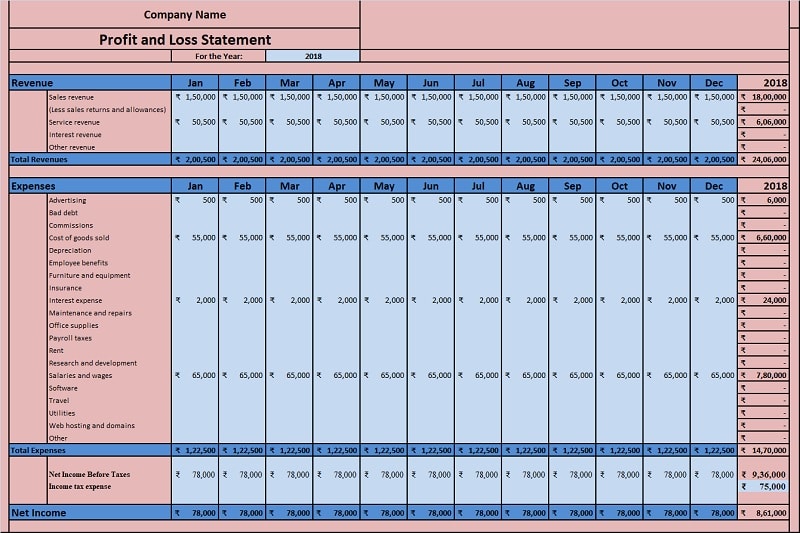
Monthly P&L Statement has similar headings as Yearly P&L Statement. The only difference in the template is the month-wise entry of all the amounts.
Furthermore, the last column consists of a predefined formula. As soon as you enter the monthly data is will sum up all the figures during that particular year.
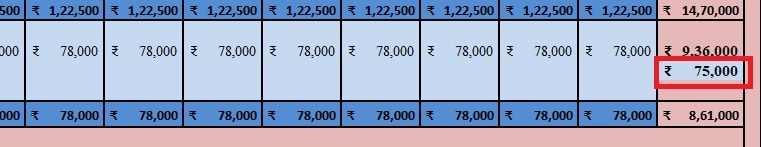
In addition to the above, businesses pay income taxes at the end of the year. Hence, insert the income tax amount in the last column to obtain net income/loss.
We thank our readers for liking, sharing, and following us on different social media platforms.
If you have any queries please share in the comment section below. We will be more than happy to assist you.
Frequently Asked Question
How an Income Statement be helpful to Investors?
An Income statement displays a company’s finances. Analyzing the previous year’s income statements, an investor or lender understands the financial performance of the business.
Moreover, it helps to predict future income projections. It helps an investor to define future revenue streams by evaluating previous income as well as and expenses.
How to calculate Net Revenue?
The formula to calculate Net Revenue is Gross Revenue – Directly Related Selling Expenses.
How to calculate Gross Income and Net Income?
Gross income is the income before taxes whereas et income is income after deduction of taxes.
What kind of revenues are included in the P&L statement?
Sales Revenue, Service Revenue, Interest Revenue, and revenue from sources other such as returns on external investments of the company.
In what ways is a P&L statement useful?
The P&L statement is a financial statement. The first and foremost use of it is for Final Accounting. In addition to that, by reviewing past expenses, a business owner can project the budget.
A business uses Income Statement Projections to obtain investment and for getting loans. An Income Statement is also useful for preparing your taxes.
How to determine Profit or Loss for a business?
When revenues are higher than the expenses then it determines profit. On the contrary, if the revenues are lower than expenses, it determines that the business is making a loss. Usually, during the first few months of inception, every business makes losses as revenues are lower.
How to analyze an Income Statement?
There are two ways to analyze an Income Statement: Horizontal Analysis and Vertical Analysis.
Horizontal analysis is the technique of evaluating financial statements analysis to know the changes in the amounts of corresponding items over a period.
Vertical Analysis is also known as a common-size analysis. It is one of the popular methods of financial statement analysis. Vertical Analysis of an Income Statement is the analysis of relative percentage change in line items. These items are compared to the previous periods.
