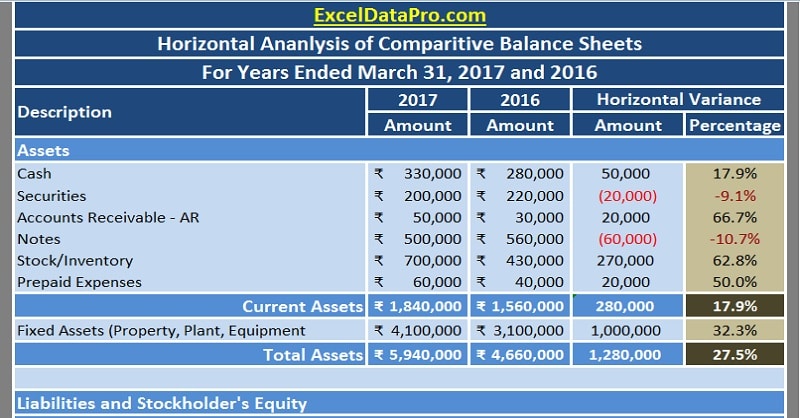
Balance Sheet Horizontal Analysis Excel Template is a ready-to-use template to compare and analyze the change between 2 years of accounting data of the balance sheet. What is Horizontal Analysis? Horizontal analysis is the technique of evaluating financial statements to know the changes in the amounts of corresponding financial items over a period. Whereas in […]
How To Use: MIN Function
Returns the smallest value from the numbers provided.
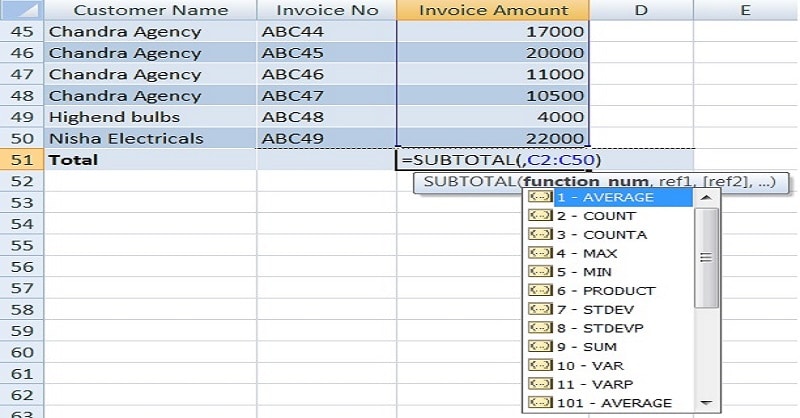
How To SUM Filtered Data Using SUBTOTAL Function In Excel
Did you know that you can use the SUBTOTAL Function to SUM filtered data in Excel? We all know filtering of data using either by inserting tables or by using filter feature in Sort and filter group. For general adding operation, we use SUM Function. But when we filter the data the total displayed is […]
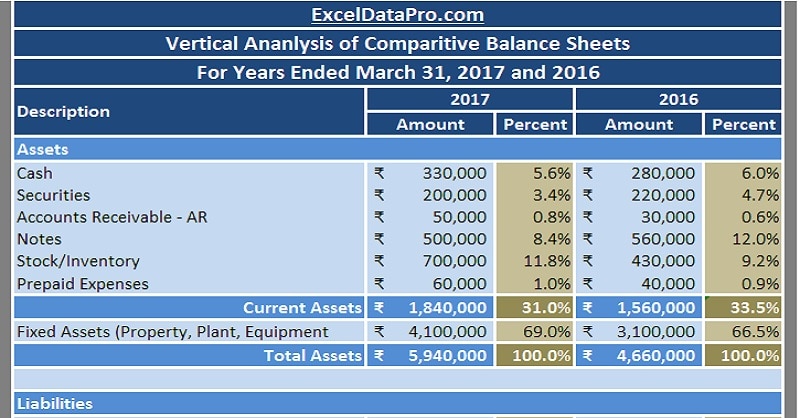
Download Balance Sheet Vertical Analysis Excel Template
Balance Sheet Vertical Analysis Template is a ready-to-use template in Excel, Google Sheet, and OpenOffice to analyze the relative percentage change over a period. Thus, just insert the respective amounts of the balance sheet in the light blue columns. The template will automatically do the vertical analysis for you.
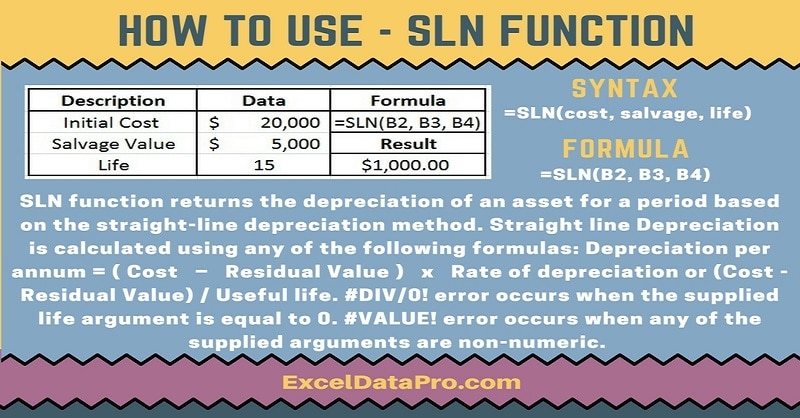
How To Use: SLN Function
Returns the depreciation of an asset for a period based on the straight-line depreciation method.


